Estancados a los 52? Repensar el subsidio de desempleo para las personas mayores en España

Por Aida Caldera, Claudia Ramírez y Dimitris Mavridis, Departamento de Economía de la OCDE

Versión en inglés

El mercado laboral español se ha recuperado con fuerza en los últimos años y creó 3,5 millones de empleos entre 2018 y 2025, pero muchos trabajadores mayores siguen desempleados. Aunque el empleo entre las personas mayores aumentó del 41% en 2004 al 61% en 2024, alrededor de la mitad de los desempleados de larga duración son trabajadores de 50 años o más. Alrededor de medio millón de solicitantes de empleo de 52 años o más llevan años sin trabajar —muchos desde la crisis de la vivienda— y afrontan grandes obstáculos para reinsertarse en el mercado laboral.

Ayudar a estas personas a reinsertarse en un empleo que aproveche sus capacidades no es solo una necesidad social o económica; es también una oportunidad. A medida que aumenta la esperanza de vida y más personas llegan a edades avanzadas en buen estado de salud, España puede hacer más para apoyar a los trabajadores mayores a mantenerse activos. Pero para lograrlo es necesario repensar reglas de prestaciones que han quedado desfasadas y reforzar los sistemas de apoyo. Con una población que envejece y una natalidad baja, alargar las carreras laborales de trabajadores sanos y con experiencia es crucial para fortalecer el crecimiento y las finanzas públicas hoy, y para proteger las pensiones en el futuro.

¿Qué está pasando? 

Una de las razones detrás del alto desempleo de larga duración entre los trabajadores mayores de 52 años en España es el diseño del subsidio por desempleo. El sistema de prestaciones por desempleo en España se apoya en dos pilares. El primer pilar es la prestación contributiva, que sustituye una parte de los ingresos previos durante un máximo de 24 meses, siempre que el trabajador haya acumulado suficientes cotizaciones. Cuando se agota la prestación contributiva, o si no se cumplen los requisitos, entra en juego el subsidio por desempleo, que ofrece una cuantía fija.

El subsidio por desempleo tiene características específicas para las personas de 52 años o más. La ayuda puede mantenerse hasta la jubilación, y la elegibilidad se basa en la renta individual y no en la del hogar. Más importante aún, el Servicio Público de Empleo Estatal (SEPE) cotiza a la Seguridad Social por cuenta del beneficiario como si estuviera trabajando a jornada completa. Para quienes tienen 52 años o más, el tiempo en subsidio genera derechos de jubilación de forma similar al empleo, con cotizaciones registradas al 125% de la base mínima de cotización. Así, hoy alrededor del 70% de quienes reciben un subsidio por desempleo de larga duración tienen 50 años o más (Figura 1).

Aunque este apoyo protege a quienes realmente lo necesitan, su diseño puede, de forma no intencionada, debilitar los incentivos a volver al trabajo, incluso para quienes desearían hacerlo. Para muchos beneficiarios mayores, aceptar un empleo a un salario bajo implica perder tanto el subsidio como las cotizaciones a la pensión que se acreditan durante el desempleo, de modo que la ganancia neta de trabajar puede ser muy reducida. La evidencia reciente muestra que el desempleo de larga duración aumenta bruscamente a los 52 años, el punto en el que se accede al subsidio especial. Mientras que a los 50 años menos del 5% de los beneficiarios lleva más de un año en desempleo, a los 52 esa cifra supera el 40% (AIReF, 2024).

Una reforma reciente reconfiguró el subsidio por desempleo

Una reforma importante que reconfigura el subsidio asistencial por desempleo comenzó a aplicarse en 2025. Amplió la elegibilidad a personas previamente excluidas, extendió la duración de la ayuda para algunos beneficiarios, aumentó las cuantías de base, e introdujo una reducción gradual con el tiempo para incentivar a retomar un empleo. También se introdujo un nuevo complemento al empleo que permite conservar una parte decreciente del subsidio durante hasta 180 días cuando se vuelve a trabajar. Sin embargo, no modificó el régimen especial del subsidio para demandantes de empleo de 52 años o más, donde persisten los mayores desincentivos a la reincorporación laboral.

Prioridades de reforma

Para facilitar carreras laborales más largas y reducir el desempleo de larga duración entre los trabajadores mayores, España podría reformar la asistencia no contributiva para las personas mayores de 52 años. Es clave igualar el apoyo entre edades, con un enfoque y una activación más precisos. En concreto, España podría reformar el subsidio por desempleo mediante:

  • armonizar las reglas para que la ayuda no se vuelva indefinida a partir de una edad concreta;
  • limitar la generación de derechos de pensión únicamente a la fase del seguro contributivo, evitando la acumulación de pensión durante la asistencia;
  • introducir una prueba de recursos por hogar para orientar los recursos hacia los más necesitados en vez de los mayores de edad;
  • reducir gradualmente el nivel de la prestación, con el tiempo y/o en función de los ingresos laborales, para evitar incentivos de “todo o nada”;
  • establecer límites razonables de duración; y
  • aplicar de forma sistemática requisitos de búsqueda activa de empleo y medidas de activación.

Al mismo tiempo, la reforma podría acompañarse de una mayor inversión en mejora de competencias. Los váuchers de formación cofinanciados por las empresas, especialmente en sectores con escasez de mano de obra o inmersos en transiciones digitales, podrían ayudar a los trabajadores mayores a reincorporarse y prosperar en el mercado laboral. Ampliar los acuerdos de flexibilidad del tiempo de trabajo y mejorar la concienciación entre los empleadores sobre el valor de los trabajadores con experiencia también favorecería la vuelta al empleo.

El mercado laboral español está mejorando, y muchas reformas recientes aún no han mostrado todo su impacto. Con la combinación adecuada de incentivos, oportunidades de recualificación y opciones de trabajo flexible, España puede aprovechar el potencial de los trabajadores con experiencia, impulsar la inclusión y afrontar sus retos demográficos y fiscales.

Referencias:

OECD (2025), OECD Economic Surveys: Spain 2025, OECD Publishing, Paris, https://doi.org/10.1787/abc5c435-en.

AIRef, (2024). Recuadro 1. El subsidio por desempleo: reformas y efectos sobre el empleo, in “Informe sobre las líneas fundamentales de los presupuestos de las AA. PP. 2025”. https://www.airef.es/wp-content/uploads/2024/12/AIReF_Informe-Lineas-Fundamentales-2025-2.pdf


Stuck at 52? Rethinking unemployment assistance for older jobseekers in Spain

By Aida Caldera, Claudia Ramírez and Dimitris Mavridis, OECD Economics Department

Spanish Version

Spain’s labour market has undergone a strong recovery in recent years adding 3,5 million jobs over 2018-2025, but many older workers are still left behind. While employment among older workers has risen overall, from 41% in 2024 to 61% in 2024, close to half of the long-term unemployed are aged 50 or older. Nearly half a million jobseekers aged 52 and over have been out of work for years, many since the housing crisis, and face major barriers to re-employment.

Helping these older workers return to meaningful work is not just a social or economic need, it’s an opportunity. As life expectancy rises and more people reach older age in good health, Spain can do more to support those older workers to stay active. But doing so means rethinking outdated benefit rules and expanding support systems. With an ageing population and low birth rates, extending the careers of healthy, experienced workers is crucial to strengthen growth and public finances today, and to safeguard pensions for the future.

What is going on?

One reason behind the problem of long-term unemployment among older workers in Spain is how unemployment assistance is designed for workers aged 52 and over. Spain’s unemployment benefit system has two pillars. First, unemployment insurance (UI) replaces a portion of previous earnings for up to 24 months, provided workers have accumulated enough contributions. When the unemployment insurance runs out, or if workers don’t qualify, unemployment assistance (UA) steps in, offering a flat-rate payment.

The unemployment assistance has special features for workers aged 52 and over. The financial support can continue until retirement, and eligibility is based on the individual’s income rather than the household’s. More importantly, the Public Employment Service (SEPE) pays pension contributions on the beneficiary’s behalf as if they were working full time. For those aged 52 and over, time spent receiving unemployment assistance builds pension rights just like actual employment, with contributions recorded at 125% of the minimum contribution base. Today around 70% of those that receive a subsidy for long-term unemployment are aged 50 or older (Figure 1).

While this support helps people who really need it, its design may unintentionally reduce incentives to work, even for those who might want to. For many older recipients, accepting a low-paid job means losing both the benefit and the pension contributions credited while unemployed, which means that the net gain from working can be minimal. Recent evidence shows that long-term unemployment increases sharply at age 52, the point when people become eligible for the special subsidy.  While fewer than 5% of assistant recipients are unemployed for over a year at age 50, that figure rises to more than 40% by age 52 (AIREF, 2024).

A recent reform reshaped unemployment assistance

A major reform reshaping unemployment assistance started to be implemented in 2025. It broadened eligibility to groups previously excluded, extended benefits for some recipients, raised payments while gradually reducing them over time to keep incentives strong, and introduced a new employment supplement that allows people to keep part of their subsidy for up to 180 days when they return to work. However, it did not change the special unemployment assistance scheme for jobseekers aged 52 and over, where the strongest work disincentives remain.

Policy priorities

To support longer working lives and reduce long term unemployment among older workers, Spain could reform the non-contributory assistance for workers aged 52 an over. It is key to equalize support across ages, with stronger targeting and clearer activation. Concretely, Spain could reform non-contributory unemployment assistance by:

  • aligning rules so support does not become indefinite at a specific age;
  • restricting pension accrual to the unemployment insurance phase only, avoiding pension build-up during assistance;
  • introducing household means-testing to target resources to those most in need rather than age;
  • tapering benefit levels gradually, over time and/or with earnings, to reduce “all-or-nothing” incentives;
  • setting reasonable duration limits; and
  • enforcing active job search and activation requirements consistently.

At the same time, the reform should go hand in hand with greater investment in upskilling. Training vouchers co-financed by employers, especially in sectors facing labour shortages or undergoing digital transitions, could help older workers re-enter and thrive in the workforce. Expanding flexible working-time arrangements and improving awareness among employers of the value of experienced workers would support reemployment.

Spain’s labour market is improving, and many recent reforms have yet to show their full impact. With the right mix of incentives, re-training opportunities and flexible work options, Spain can unlock the potential of experienced workers, support inclusion and address its demographic and fiscal challenges.

References:

OECD (2025), OECD Economic Surveys: Spain 2025, OECD Publishing, Paris, https://doi.org/10.1787/abc5c435-en.

AIRef, (2024). Recuadro 1. El subsidio por desempleo: reformas y efectos sobre el empleo, in “Informe sobre las líneas fundamentales de los presupuestos de las AA. PP. 2025”. https://www.airef.es/wp-content/uploads/2024/12/AIReF_Informe-Lineas-Fundamentales-2025-2.pdf


How the Lucky Country Can Stay That Way: Improving Productivity Growth, Housing Affordability and Fiscal Sustainability in Australia

Australia is often called the “Lucky Country,” but maintaining high living standards will require reforms to lift productivity growth, restore housing affordability, and strengthen fiscal sustainability. Drawing on the OECD Economic Survey of Australia 2026, this blog highlights key priorities—from boosting competition and business dynamism to easing housing supply constraints and improving the tax mix—while keeping long-term resilience and climate risks in view.


By Geoff Barnard and David Cashin, OECD Economics Department

Today Australians are marking their national day, with citizenship ceremonies, community celebrations, awards, speeches and sporting events. As they do each year on this day, they are reflecting on their history and looking to the future. The OECD’s latest Economic Survey of Australia, released last week, confirms that they have good reason to be proud of their achievements and optimistic about what lies ahead.

Australia enjoys enviable macroeconomic stability and some of the highest living standards among OECD countries, supported by strong institutions and abundant human capital. At the same time, policymakers must grapple with a number of challenges to ensure that macroeconomic stability is maintained and living standards continue to rise.

Like much of the rest of the world, Australia’s economy went through a series of large fluctuations in the years since the onset of the COVID-19 pandemic, experiencing multi-decade highs and lows for GDP growth, inflation, unemployment and interest rates, as well as large swings in budget balances. Australia continued, however, to prove relatively resilient, with lower peak inflation than most OECD peers and avoiding recession in the post-pandemic period as interest rates rose. And there is evidence that the turbulence of the recent past is subsiding, with growth picking up, inflation converging on target, unemployment low and public finances stabilising.

While the ratio of public debt to GDP jumped during the pandemic, it remains low compared to most OECD countries, and the general government deficit is likely to narrow slightly over the next few years. Even so, to safeguard fiscal sustainability and maintain room for manoeuvre, budget deficits at the national and state levels will need to be reduced further over the medium term through a well-designed combination of expenditure restraint and revenue-enhancing tax reforms. In doing so, there is scope to improve the efficiency of the tax mix, notably by broadening the base of the Goods and Services Tax via reduced exemptions and perhaps also a higher rate, while reducing the reliance on taxes on labour.

Housing is an especially pressing policy issue. Although Australia is among the countries with the highest average living space per person, housing affordability is severely strained. The ratio of house prices to income rose by more in Australia over the past 30 years than in any other OECD country, and with the sharp rise in interest rates from mid-2022, mortgage payments increased rapidly in the last few years, given Australia’s high share of adjustable-rate mortgages. Rent inflation also surged at this time, and more than half of low-income renters are in rental stress (paying more than 30% of income in rent). The main cause of the affordability crisis is the persistent failure for new housing supply to keep pace with household formation, and the key to resolving it is removing supply constraints, in particular by easing restrictive land-use regulations at the local level. This is especially critical in the major cities, where higher-density construction should be facilitated, particularly around transport connections. It would also be helpful to build more social housing, which accounts for about 4% of the housing stock, down from 6% in 1990 and only about half the OECD average.

Source: OECD Analytical house price indicators and Australian Bureau of Statistics.

While the fall in economy-wide labour productivity since 2021 largely reflects a combination of cyclical and idiosyncratic factors related to the pandemic, trend productivity growth has slowed over the past 20 years, and this has coincided with a fall in business dynamism and a rise in market concentration, markups and profit margins. Firm entry and exit plays a key role in productivity growth via creative destruction and resource reallocation, as more productive firms expand and less productive ones are displaced. To reinvigorate productivity growth and reduce cost-of-living pressures on consumers, reforms are needed to encourage greater competition. The government’s Competition Review that began in 2023 has taken promising steps towards these objectives, including the introduction of a mandatory notification merger regime and an agreement between the Commonwealth, state and territorial governments to revitalise the country’s National Competition Policy. However, additional measures to improve competition will be needed, including successful implementation of the new merger regime, a strengthening of abuse-of-dominance enforcement, boosting the powers of the Australian Competition and Consumer Commission and tackling barriers to competition due to regulatory fragmentation within Australia’s federal system. Adopting an expedited approach to recognising trusted overseas standards and reducing regulatory restrictions on foreign direct investment would also help.

The recent severe bushfires and floods in Victoria are just the latest reminder of Australia’s vulnerability to climate change. Apart from the risk to human life, rising temperatures and extreme weather events can damage infrastructure and other capital (including natural capital) and negatively affect labour productivity. Australia needs both to continue making progress on policies to mitigate climate change and to further develop and implement its relatively advanced plans for adaptation.  Carbon emissions, while still among the highest in the OECD in per capita terms, are falling towards Australia’s 2030 target, and the targets for 2035 announced last year reflect a high degree of ambition, but further policy efforts will be needed to achieve the goal of Net Zero by 2050. Challenges remain to expand the share of renewables in the electricity grid and manage the transition as coal exits the electricity system; reduce emissions in transport and agriculture; and ensure that land-use regulation reflects climate risks. Australia has among the lowest net effective price of carbon emissions in the OECD, and greater use of pricing, including via the Safeguard Mechanism for industrial emissions as well as in agriculture, would help to achieve the Net Zero objective.

Check out the launch presentation and brochure on the Economic Snapshot of Australia web page.

References:

Read the full Economic Survey: OECD (2026), OECD Economic Surveys: Australia 2026, OECD Publishing, Paris


Stablecoins on the rise: A risk for financial stability? 

By Caroline Roulet, OECD Economics Department.

Stablecoins are a type of crypto-asset designed to maintain a stable value by anchoring to a reference asset (often US Treasury bills). They offer convertibility on demand at par, and fee-free, immediate and pseudonymous transactions, making them an attractive means of payment, especially across borders. The market value of stablecoins has risen rapidly, with two issuers that mainly rely on USD-denominated collateral accounting for almost 90% of the global market capitalisation (Figure 1). Stablecoins are still only a small part of financial markets, but as they expand and become more intertwined with traditional finance they pose non-negligible risks to financial stability and important challenges for financial regulation and monetary policy.

As discussed in the latest OECD Economic Outlook the total value of payments using stablecoins surpassed that of major traditional digital payment providers in 2024-25 (Figure 2, Panel A). Currently, stablecoins are mainly used to settle trades in other crypto-assets, and now account for around 80% of all trades on crypto-asset platforms (ECB, 2025), although usage for other payments by corporates and households has begun to rise.

Though less risky than crypto-assets as a whole, some stablecoins have experienced significant price volatility, particularly those that are not fiat-collateralised (i.e. not fully backed by assets denominated in currency terms, such as US Treasury bills or bank deposits). Fiat-collateralised stablecoins have been much more stable, but still often deviate from par in secondary markets (Aldasoro et al, 2025). In contrast to the majority of bank deposits, stablecoins are typically uninsured. Variation in the value of their backing assets (and subsequent deviations of stablecoins’ market value from their original face value) can therefore prompt holders to request redemptions, with ensuing risks of liquidity shortages and fire sales of collateral.

The expansion of stablecoins raises financial stability risks. One concern is the potential effects on the pricing and operation of segments of critical funding markets, such as sovereign debt markets (Aldasoro et al., 2025), as stablecoin issuers are now major holders of US Treasury bills (Figure 2, Panel B). Investor inflows into stablecoins and asset sales to meet redemptions could thus affect short-term bond yields and hence monetary policy transmission. Stablecoin issuers’ generation of additional income through reverse repos (lending securities to traditional financial intermediaries who then pledge them as collateral) may also add to potential strains on repo market liquidity at times of stress.

Figure 2. Stablecoin transactions are expanding and holdings of US Treasury bills are sizeable

Note: In Panel A, Visa and Mastercard payments primarily reflect settlements for goods and services, while stablecoins have been primarily used so far to settle trades in other crypto-assets. Payments data (Gross Dollar Volume, GVD) for Mastercard in 2025 is available through Q3, with Q4 estimated using the average GDV from the first three quarters. Panel B reports holdings of US T-bills by selected domestic and foreign holders and major stablecoins issuers (Tether and USD Coin) as of 2025 Q3.
Source: Artemis Analytics; Tether and USD Coin transparency reports; US Federal Reserve; US Department of the Treasury; Visa and Mastercard annual reports; and OECD calculations.

The expansion of stablecoins may also pose risks to banks. Companies with crypto-related business models, including stablecoin issuers, also hold bank deposits (as required by regulation in some jurisdictions). This could prove an unstable deposit base if stablecoin issuers suddenly withdraw funds to meet liquidity needs (ECB 2025), potentially disrupting bank credit availability.

The growing adoption and use of stablecoins, alongside their ability to circulate freely across borders, poses economic policy challenges. In emerging-market economies, the use of foreign‑currency denominated stablecoins could raise exchange rate volatility at times of stress and enable foreign exchange regulations to be bypassed. This would make standard indicators of capital outflows harder to interpret. More broadly, usage of foreign currency denominated stablecoins could weaken the control of monetary conditions by domestic central banks (BIS, 2025; Rey, 2025). The potential use of stablecoins for illicit activities is a further concern, raising challenges for the enforcement of anti‑money laundering and financing of terrorism regulations.

Many countries have begun to develop tailored regulations relating to stablecoins, and crypto-assets more generally. Prominent recent examples include the GENIUS Act in the United States (Guiding and Establishing National Innovation for U.S. Stablecoins Act, enacted in July 2025) and the MiCA (Markets in Crypto-Assets) Regulation in the European Union, which became effective from December 2024. However, regulatory approaches differ across countries and significant gaps and inconsistencies remain (FSB, 2025). The limited oversight of cross-border transactions is a key challenge, potentially hampering responses to systemic risks and encouraging regulatory arbitrage. The rapid growth of the stablecoin market, and the impact stablecoin usage may have on other asset markets, highlights the need for enhanced international cooperation to ensure effective regulation, supervision, and oversight of stablecoins in all jurisdictions.

REFERENCES

ECB (2025), “Just another crypto boom? Mind the blind spots”, Financial Stability Review, May, European Central Bank.

Aldasoro, I., M. Aquilina, U. Lewrick, and S. Lim (2025), “Stablecoin growth – policy challenges and approaches,” BIS Bulletins 108, Bank for International Settlements.

BIS (2025), Annual Economic Report, Chapter 3 “The next-generation monetary and financial system”, June, Bank for International Settlements.

FSB (2025), Thematic Review on FSB Global Regulatory Framework for Crypto-asset Activities, Financial Stability Board, Geneva. Rey, H. (2025), “Stablecoins, tokens, and global dominance”, IMF Finance and Development magazine, September.

Rey, H. (2025), “Stablecoins, tokens, and global dominance”, IMF Finance and Development magazine, September.


Building a better housing market in Denmark: a reform package to improve efficiency, raise supply and enhance affordability

Biking along the streets of Copenhagen

By Jarmila Botev, Peter Hoeller, Caroline Klein

Danish housing policy aims at providing quality and affordable accommodation to all in an egalitarian way. Access to quality housing is good overall, but housing costs are relatively high (Figure 1), especially in major cities like Copenhagen and residential mobility has been low. This calls for a broad reform over time covering housing taxation, land use planning, building and rental regulation and social housing. The 2026 Economic Survey of Denmark, released today, takes a closer look at current challenges in the Danish housing market and lays out reform options. 

Reforming building regulations to raise supply responsiveness 

A slow response of new housing to growing or changing demand can raise price pressure. Streamlining land use governance and building regulations to raise supply flexibility can thus improve affordability. For example, building regulations can set rules on floor area, building height or number of storeys and this can lead to low urban density.  Allowing greater building density, especially in areas close to transport links and where shortages are high, would raise housing supply. Moreover, land-use governance currently overlaps across different administrative levels. This fragmentation can impede housing development projects. Focusing planning at the metropolitan level rather than at lower levels of government can enhance the responsiveness of housing supply to evolving demand within broader areas. 

Easing rent regulation to improve the functioning of private rental markets

Denmark’s private rental market is small and a large share of it is regulated. Denmark has strict rent control for houses built up until 1991, making up around three quarters of private rental housing. Stringent rent control can lead to rationing, so that homes are allocated based on waiting lists or personal contacts. Incumbent tenants are, in turn, less likely to move when they need to, for instance for a new job, or tend to live in dwellings that are larger than they need. In addition, rent control does not benefit those who need the most – it is most favourable for high-income households (Figure 2). Aligning regulated rents more closely with market rents, for instance by indexing rent increases on wage growth, would lead to a better functioning housing market. Easing rent control could raise affordability concerns for low-income households, but these can be addressed through targeted increases in housing allowances. Unlike rent control, housing allowances can focus support on those who need it most. This makes them a more efficient tool for preserving housing affordability.  

Reforming social housing to increase access of those most in need 

The Danish social housing sector, called “non-profit housing”, is one of the largest in the OECD, making up about 20% of the total housing stock. It follows a universalist approach, with all households being eligible, with no income threshold and is cost-based, with below-market rents. Investment in social housing contributes to increasing housing supply, resulting in greater affordability in the overall housing market. However, the existing cost cap legislation provides little flexibility for building new social housing, as building costs rise. The planned cap increase is therefore a welcome development, though its effectiveness needs to be assessed. 

In addition, the existing social housing stock is not well geared to house those most in need, with long waiting times, especially in big cities like Copenhagen. Incentives for residents to move out of social housing, when their economic situation improves, should exist, to make room for tenants with greater need. The allocation of social housing should be rebalanced from better-off households, for instance by periodic eligibility reviews, fixed-term tenancies or indexing social rents to individual income, while preserving inclusive and socially mixed neighbourhoods.

Reforming housing taxation to increase efficiency and lower house prices 

Denmark provides tax relief for mortgage interest payments and the property value tax is low (Figure 3). Favourable tax treatment of housing lowers the after-tax cost of owning compared with renting and pushes up housing demand, thereby raising prices if supply is rigid. Phasing out mortgage interest relief or raising the property value tax gradually can thus reduce house prices substantially over time. In the long term, lower house prices facilitate homeownership of a larger share of the population and drive down rents. In the medium term, removing the tax advantage would make those benefitting from it worse off, therefore the reform should be gradual, as was the case for instance in France, the United Kingdom, the Netherlands and Finland. 

A well-tailored package of reforms can improve the functioning of Danish housing market 

Housing involves complicated trade-offs between objectives and avoiding unintended consequences. While Denmark has managed many of these well to achieve good outcomes, a well-tailored package of measures would help ensure that housing policy continues to work well as society evolves and that new housing is built where it is needed. Experience from OECD countries shows that reforms and progress are often gradual and so delay is costly.  

For more information, visit the Denmark Economic Snapshot page.

References:

OECD (2026), OECD Economic Surveys: Denmark 2026, OECD Publishing, Paris, https://doi.org/10.1787/3d6cb4b8-en


Powering competitiveness: Europe’s path to energy security and growth

by Ruben Maximiano and Wouter Meester, OECD Economics Department.

Europe’s competitiveness is increasingly linked to the availability of secure, affordable and reliable electricity. As electrification accelerates across industry, transport, heating and digital services, including AI data centres, power has become a strategic input to growth, investment and innovation, a point also underscored by the 2024 Draghi report. However, as outlined in a recent OECD report Diagnostic Tool for Reducing Regulatory Barriers to Solar, Wind and Pumped Hydro Storage in the EU, five key types of regulatory barriers slow the deployment of these technologies in Europe. This results in significant opportunity costs, especially in the European Union, where high import dependence exposes firms and households to price volatility, supply shock and higher prices.

The 2021–22 energy crisis laid bare this vulnerability: the EU’s energy import bill surged from EUR 137 billion in 2020 to nearly EUR 549 billion in 2022. Even after prices eased, the 2023 import bill remained well above historical levels.

Why the electricity system is changing and why rules matter

At the same time, Europe’s power system is being reshaped by technologies with fundamentally different system characteristics, including variable renewables, storage, demand-side response and digital controls. These resources increase the need for flexibility, real-time coordination across grids and more granular planning, particularly as new electricity-intensive loads, such as data centres, concentrate demand in specific locations. This transformation exposes the limits of regulatory frameworks designed for a centralised, thermal-based system. Ensuring the EU’s energy security, including by delivering its new energy mix, depends on fit-for-purpose regulation as much as on physical infrastructure.

Competitiveness increasingly depends on affordable, “always-on” electricity

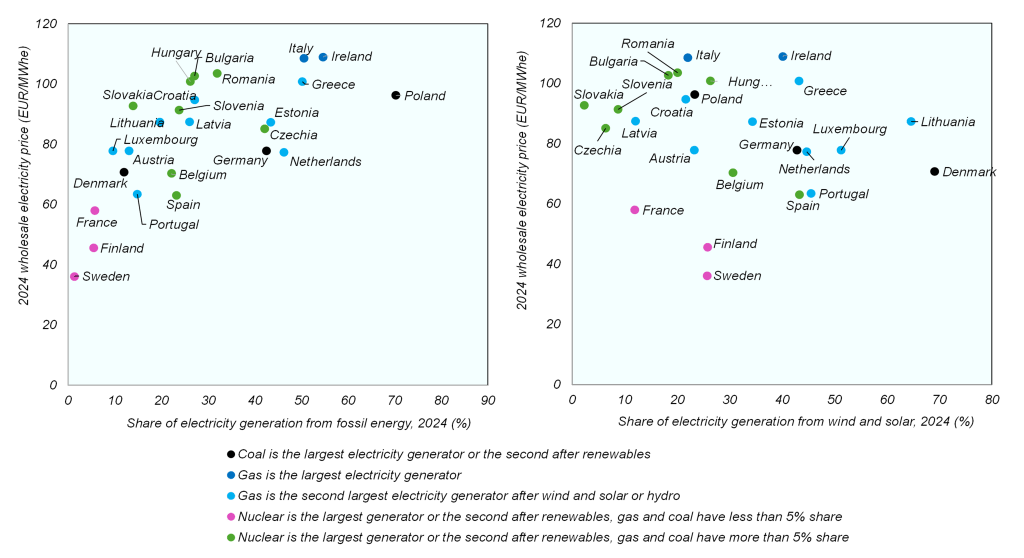
In addressing its energy security, Europe has already made important progress. Since Russia’s invasion of Ukraine, renewable energy has expanded substantially, helping to cushion price shocks (see Figure 1). Evidence suggests that EU countries with higher shares of wind and solar in their electricity mix tend to exhibit lower wholesale prices on average (Figure 2), reflecting the declining technology costs and the downward pressure renewables place on marginal pricing. Moreover, recent system-level modelling by WindEurope shows that, even once the additional cost of grids, storage and backup capacity are taken into account, a renewables-led pathway is the lowest-cost option for Europe’s power system.

Figure 2. Relationship between the average wholesale electricity prices and the share of electricity generation from wind and solar in EU Member States, 2024

Source: OECD calculations based on Ember Yearly and Hourly Electricity Data

Yet the next wave of electrification will put (even greater) pressure on the EU’s electricity system. For example, in the EU, demand from data centres could rise from around 96 TWh in 2024 to about 236 TWh by 2035, increasing their share of total electricity use from 1.5% to nearly 6%.

Energy system upgrades require regulatory upgrades – and a tool to help deliver them

This increasing electrification, with more decentralised generation, new flexibility technologies and large, concentrated loads such as data centres, requires regulatory frameworks that are aligned with these new system characteristics.

In this context, regulation increasingly functions like infrastructure itself: it must be planned ahead of need, operate reliably, and remain aligned with system needs. Outdated or fragmented rules quickly become binding constraints on investment, adding years to project timelines and raising costs. As such, modernising and simplifying regulatory frameworks have become a strategic lever of energy security and competitiveness.

Recent EU legislation, including the Renewable Energy Directive III, provides an important foundation. Implementation at national level, however, will determine whether projects proceed from pipeline to operation.

Across EU Member States, five recurring regulatory barriers consistently slow deployment and undermine system efficiency:

First, unclear or restrictive legal frameworks create uncertainty and deter market entry, particularly for newer solutions. Where rights and permitted uses have been clarified – such as enabling dual land use for both agriculture and PV solar in France and Italy – deployment has accelerated; where ambiguity persists, projects stall.

Second, insufficient remuneration for new system services limits investment, for instance in flexibility. Many frameworks still do not reward services such as inertia or fast frequency response on a standalone basis, despite their growing importance for system stability. Ireland’s recent market reforms to remunerate these ancillary services illustrate how rule changes can unlock these services.

Third, infrequent and inefficient spatial planning and permitting remain a major drag on investment. Complex, sequential procedures involving multiple authorities often result in long timelines distorting siting decisions and raising financing costs. Where procedures have been simplified, impacts have been immediate and significant: reform to grid-permitting rules in Germany have enabled the Federal Network Agency (BNetzA) to approve roughly four times more transmission-line kilometres in 2024–25 than in previous years (see figure 3).

Fourth, outdated grid-connection rules create artificial bottlenecks. First-come, first-served queues allow speculative projects to hold capacity delaying viable investments. Sweden’s readiness-based connection rules show how prioritisation can improve outcomes without new infrastructure.

Finally, grid-investment frameworks still contain structural disincentives that limit system optimisation. Regulation often favours capital-intensive network expansion while constraining anticipatory investment, flexibility procurement, and digital solutions. In some Member States, system operators cannot recover the costs for non-wire alternatives, even when these are faster and cheaper than traditional reinforcement.

These barriers can add years to project timelines and increase financing costs. They affect not only renewable developers but also energy-intensive industries, such as AI infrastructure and advanced manufacturing, that require stable, low-cost electricity to remain competitive.

To address these barriers systematically, the OECD has developed the Diagnostic Tool for Reducing Regulatory Barriers to Solar, Wind and Pumped Hydro Storage in the EU for the European Commission. The Tool helps policymakers at national and sub-national levels identify where rules are misaligned with system needs, prioritise reforms, and coordinate implementation – providing a practical roadmap for accelerating electrification while strengthening both energy security and competitiveness.

With clear rules, coordinated planning and tools such as the OECD Diagnostic Tool, the EU can move from energy dependence toward electric resilience – strengthening both economic competitiveness and energy security.

*We will be launching the Diagnostic Tool on 29th January. You may register here.

References

European Commission, 2024, Study on energy prices and costs – evaluating impacts on households and industry’s costs – 2024 edition

Draghi, M., 2024. The Future of European Competitiveness—A Competitiveness Strategy for Europe

IEA, 2025, Energy and AI, World Energy Outlook Special Report

IEA, 2023, Renewable Energy Market Update Outlook for 2023 and 2024

OECD, 2025, OECD–EU Diagnostic Tool for Reducing Regulatory Barriers to Solar, Wind and Pumped Hydro Storage

WindEurope and Hitachi, December 2025, Delivering a cost-effective energy system for Europe


Making housing more affordable in Portugal

Building a hug housing complex in Portugal

Portugal’s housing has become increasingly unaffordable. This blog explores the causes and outlines coordinated reforms to boost supply, mobilise housing, and expand support.

By Timo Leidecker, Antoine Goujard and Aida Caldera-Sanchez, OECD Economics Department


Being a young adult or family in Portugal looking for a home is difficult. For many it has become seemingly impossible to find an affordable home to buy or rent: 44% of respondents in a 2023 survey considered leaving Portugal due to difficulties to find affordable housing (Azevedo and Santos, 2023). After house prices have doubled over the last decade, well outpacing incomes, high housing costs eat into people’s living standards, prevent young people from starting a life on their own, or from going after promising jobs and career prospects if they live far away from where jobs are concentrated (Fig. 1).

Portugal’s housing pressures did not emerge overnight and cannot be blamed solely on the spread of short-term rentals or golden visa programmes. They result from several, long-standing issues: a collapse in construction during the economic crisis, high construction costs, a high share of Portugal’s large housing stock lying idle or only being used ineffectively, and inadequate housing support – all amplified in recent years by rising domestic as well as foreign demand.

What can be done? Successive governments have taken welcome steps aimed at expanding housing supply and support, including through tax exemptions for young first-time buyers and investments in social housing. Yet, as the 2026 OECD Economic Survey of Portugal argues, more decisive action is needed to deliver an effective and lasting solution. The OECD Survey identifies additional reform priorities, including to cut red tape in construction, strengthen fiscal incentives to mobilise existing housing, and provide more well-targeted housing support.

Boosting new construction and making better use of existing housing

New housing supply is held back by high construction costs, including from complex administrative procedures. Digitalising procedures and harmonising requirements for building permits across municipalities would speed up procedures and reduce uncertainty – particularly for smaller firms. High land prices further limit affordability. While recent reforms simplified access to land mostly for social housing, a broader review of spatial planning is needed to remove barriers to sustainable development more generally.

At the same time, fiscal incentives to use existing housing more effectively remain weak. Recurrent property taxes are low, including for those who rarely if ever use or rent their home. Transactions taxes are relatively high for households wishing to buy or downsize (although these were mitigated for young people through transaction tax exemptions). Outdated property tax values are a key contributing factor for the low effective recurrent taxation of housing wealth (Fig. 2). These features help explain the high share of vacant or seasonal homes across the country – even in high-demand areas – and mean that long-standing homeowners have often benefited from largely untaxed capital gains, while younger generations struggle to enter the market.

Gradually shifting from transaction towards recurrent taxes of immovable property, and raising taxation on underutilised housing where demand is high, would help bring more homes onto the market. Regularly updating taxable property values to reflect market prices would strengthen these incentives and improve equity.

Figure 2. Updating tax property values would strengthen fiscal incentives to use housing efficiently and improve equity

Note: Panel A: The OECD average is computed based on preliminary data. Data for Greece are missing. A selection of OECD countries is shown.
Source: OECD Revenue Statistics (database); Eurostat..

Scaling up social housing and housing allowances

Even with more flexible housing markets, many households will remain unable to afford adequate housing at market prices. Portugal has one of the smallest social housing stocks of the OECD (Fig. 3), and waiting lists for social housing are long – exceeding three years for example in Porto. Investment is increasing but further expansion will be needed. Given municipalities central role, this will hinge on providing targets adapted to local needs and ensuring adequate funding.

As long as social housing remains scarce, housing allowances in the private rental market will play a crucial role. Current spending – at around 0.1% of GDP in 2022 – is limited and aimed reaches more households with high incomes than low-income households. Better targeting and ensuring adequate benefit levels are essential to ensure access to decent housing while containing fiscal costs.

A coordinated reform package is essential

Portugal’s housing affordability challenge is solvable—but only through a comprehensive reform package. Because the underlying causes are deeply interconnected, isolated measures risk being ineffective or counterproductive. Expanding housing support without boosting supply can push prices even higher; rebalancing rental regulations without adequate allowances can increase hardship. Reducing supply constraints would, in turn, lower construction costs, including for social housing, while making private rental investment more attractive.

Implemented together, the reforms proposed in the OECD Survey—to expand supply, mobilise existing housing, and strengthen housing support—can help restore better functioning housing markets. As a package, they would help ensure that everyone can find a suitable home they can afford—an outcome that is key not only to Portugal’s economic prosperity, but to its social and generational fabric.

For more information, visit the Portugal Economic Snapshot page.


References:

OECD (2026), OECD Economic Surveys: Portugal 2026, OECD Publishing, Paris, https://doi.org/10.1787/abc5c435-en.

Azevedo, A. and Santos, J. (2023), Housing Barometer, Francisco Manuel dos Santos Foundation https://ffms.pt/sites/default/files/2023-11/BarometroHabitacao-v7.pdf


Aprovechar el impulso de España para sostener el crecimiento y la convergencia de ingresos

Por Aida Caldera, Claudia Ramírez y Dimitris Mavridis, OCDE

Versión en inglés

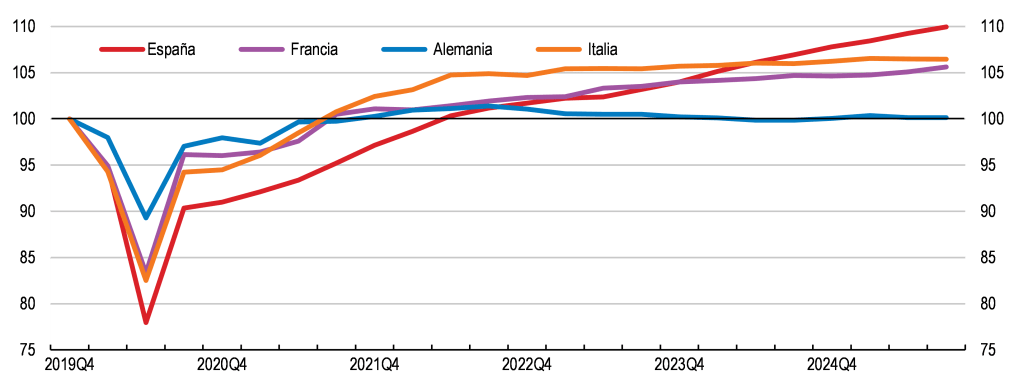
Desde la pandemia, la economía española ha crecido de manera firme y más rápido que muchos de sus pares europeos (Gráfico 1). El crecimiento se ha visto respaldado por una fuerte inversión, principalmente pública, el aumento de las exportaciones de servicios y una rápida expansión de la fuerza laboral ya que muchos inmigrantes, principalmente procedentes de América Latina, se han integrado rápidamente en el mercado laboral. El empleo está creciendo en todos los sectores, mientras que el desempleo ha descendido de alrededor del 15% en 2021 al 10,5% en septiembre de 2025, aunque sigue siendo el más alto de la Unión Europea. Los contratos temporales, que durante mucho tiempo han sido el punto débil de España, han descendido de más del 25% a aproximadamente el 16% en los tres años posteriores a la reforma del mercado laboral de 2021.

Más allá de estos encabezados alentadores, un desafío en materia de productividad amenaza con debilitar la prosperidad a largo plazo de España, como se destaca en el recientemente publicado Estudio Económico de España de 2025. El crecimiento sostenido y la convergencia de los ingresos con otros países similares de la OCDE dependen de la aceleración del crecimiento de la productividad y del aprovechamiento de los recursos sin explotar.

Gráfico 1. El crecimiento del PIB ha superado recientemente al de otros países europeos

Producto interior bruto, volumen, datos ajustados por estacionalidad y efecto calendario, índice 2019T4 = 100

Fuente: Eurostat.

Le reto de la productividad

España está creando empleo a un ritmo más rápido que la mayor parte de Europa, y la productividad por trabajador ha crecido desde 2022, especialmente en los sectores del comercio, el transporte y la hostelería. A pesar de esta mejora, el PIB por hora trabajada en España seguía estando un 7% por debajo de la media de la UE en 2024 (Gráfico 2, Panel A). Este déficit de productividad no se limita a un solo sector rezagado, sino que afecta tanto a las actividades comercializables como a las no comercializables, así como a empresas de todos los tamaños.

El crecimiento del PIB se mantendrá sólido, con un 2,9% en 2025, un 2,2% en 2026 y un 1,8% en 2027, a medida que se normalice la expansión del turismo y se moderen los flujos migratorios. Para mantener este impulso de crecimiento y acelerar la convergencia de los ingresos, será fundamental reforzar el crecimiento de la productividad.

La oportunidad de las pymes

Las pequeñas y medianas empresas son el centro del desafío de productividad de España, y son igual de importantes para superarlo. Las pymes son el 99% de todas las empresas españolas y emplean a casi dos tercios de la fuerza laboral, lo que las coloca en el centro del motor económico del país. Sin embargo, comparado con pares de otros países, las pymes españolas tienden a ser más pequeñas, crecer más lentamente y operan a niveles de productividad significativamente más bajos que los países con mejor rendimiento de la OCDE (Gráfico 2, Panel B). Estas diferencias reflejan las mayores restricciones financieras a las que se enfrentan las pymes, sus menores índices de innovación y las desproporcionadas cargas normativas y de cumplimiento que este grupo de empresas soportan en comparación con las pymes de muchas otras economías europeas.

Consciente de estos retos, España ha puesto en marcha una ambiciosa agenda para las pymes respaldada por el Plan de Recuperación, Transformación y Resiliencia, que destina alrededor del 40% de los fondos en subvenciones al emprendimiento, la digitalización y la internacionalización. Sin embargo, aún se puede hacer más para liberar el potencial de las pymes:

  • Mejorar el acceso a la financiación mediante el fortalecimiento de los canales de financiación basados en el mercado y la conexión de las pequeñas empresas con los participantes en los mercados de capitales, al tiempo que se sensibiliza a las pequeñas empresas sobre las opciones de financiación no bancaria disponibles.
  • Simplificar la regulación y los procedimientos administrativos que más afectan a las empresas más pequeñas, incluyendo la introducción gradual de umbrales regulatorios que provocan aumentos repentinos en los costes de cumplimiento cuando las empresas crecen.
  • Simplificar los procedimientos de solicitud y reembolso de las ayudas públicas a la I+D, entre otras cosas mediante la creación de una plataforma digital única.
  • Cerrar las brechas de competencias mediante ofertas de formación más accesibles, procedimientos simplificados y una mayor divulgación, de modo que las pymes puedan invertir sistemáticamente en la mejora de las competencias y el reciclaje profesional de su personal.

Cuando se combinan, estas iniciativas pueden ayudar a las empresas más pequeñas a desarrollar todo su potencial. Incluso modestas ganancias de productividad en miles de pymes se traducirían en efectos agregados considerables y una convergencia sostenida de los ingresos.

Gráfico 2. A pesar de mejoras recientes, la productividad laboral se mantiene por debajo del promedio europeo

Nota: En el panel B, los cinco países con mejores resultados para las grandes empresas excluyen a Irlanda y Noruega, donde la productividad laboral supera los 416 000 USD en 2023.
Fuente: Estadísticas de niveles de productividad de la OCDE; Estadísticas estructurales de empresas de la OCDE.

Aprovechar el potencial de trabajadores mayores y migrantes

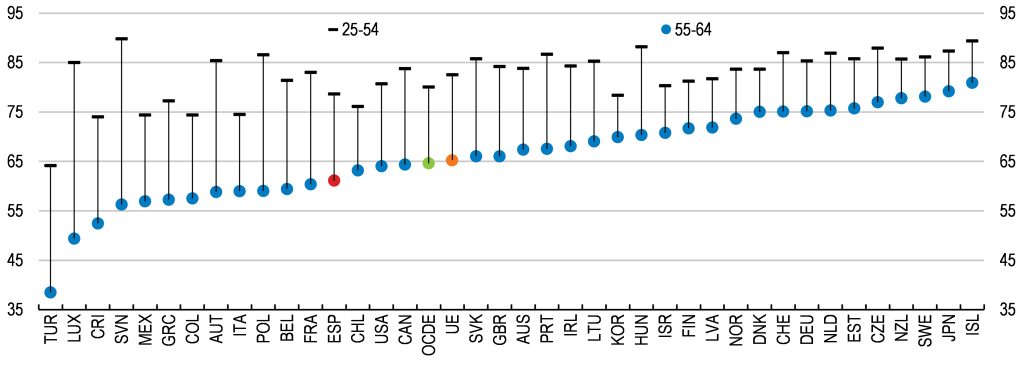
La urgencia del reto de la productividad en España se hace aún más evidente cuando se tiene en cuenta la demografía. El envejecimiento de la población y las bajas tasas de empleo entre los trabajadores de más edad (Gráfico 3) pueden reducir la oferta de mano de obra, ralentizar el crecimiento potencial y aumentar las presiones fiscales, a pesar de los vientos favorables que ha supuesto el aumento de la migración en los últimos años. España se enfrenta a una de las transiciones demográficas más pronunciadas de la OCDE, con un aumento previsto de la tasa de dependencia de las personas mayores de alrededor de 41 puntos porcentuales entre 2024 y 2054. Sin embargo, estos retos encierran un potencial sin explotar que puede convertirse en beneficio si se adoptan medidas decididas:

  • Reformar las ayudas por desempleo no contributivas para mayores de 52 años, que actualmente funcionan como una jubilación anticipada de facto. Esto puede abordarse limitando la duración, restringiendo la acumulación de pensiones únicamente a la fase de seguro de desempleo, introduciendo la comprobación de recursos económicos y reforzando los requisitos de activación.
  • Prolongar la vida laboral alineando más estrechamente los incentivos de jubilación con la mayor esperanza de vida, al tiempo que se mejoran las condiciones de trabajo y las opciones de formación para los trabajadores de más edad, por ejemplo, mediante bonos de formación individuales cofinanciados con los empleadores.
  • Aprovechar mejor la migración. Los trabajadores nacidos en el extranjero ya representan una gran parte de la creación de empleo reciente, pero muchos están sobrecalificados para sus puestos de trabajo. Simplificar y agilizar el reconocimiento de títulos y hacer que los canales de migración respondan mejor a las necesidades del mercado laboral aumentaría tanto la eficiencia como la equidad.

Gráfico 3. Elevar las tasas de empleo de los trabajadores mayores es crucial para abordar el reto demográfico de España

Tasas de Empleo por edades, %, 2024

Fuente: Estadísticas de la OCDE sobre la población activa.

El resultado final

El crecimiento económico reciente de España ha sido sólido. Para mantener este impulso, es necesario cambiar el enfoque de la creación de empleo al crecimiento sostenido de la productividad. Las prioridades políticas deben seguir empoderando a las pymes mediante una mejor financiación y una menor burocracia, activar a los desempleados de más edad, prolongar la vida laboral y aprovechar el talento de los inmigrantes. España tiene ahora una oportunidad para impulsar las reformas. Las decisiones que se tomen en esta fase determinarán si la resiliencia actual se convierte en la convergencia del futuro.

Referencias:

OECD (2025), OECD Economic Surveys: Spain 2025, OECD Publishing, Paris, https://doi.org/10.1787/abc5c435-en.


Leveraging Spain’s momentum to sustain growth and income convergence

By Aida Caldera, Claudia Ramírez and Dimitris Mavridis, OECD

Spanish version

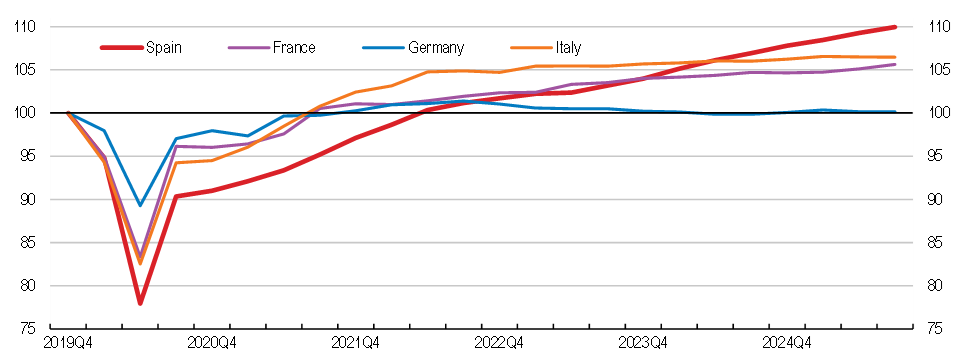
Since the pandemic, Spain’s economy has grown robustly and faster than most peer countries in the Euro Area (Figure 1). Growth has been supported by strong investment, particularly public investment, rising exports in services and a rapid expansion of the labour force, as many migrants, mainly from Latin America, have integrated quickly into work. Employment is growing across sectors, while unemployment dropped from around 15% in 2021 to 10.5% in September 2025, although it remains the highest in the European Union. Temporary contracts—long Spain’s vulnerability— have fallen from over 25% to roughly 16% in the three years after the 2021 labour market reform.

Beneath these encouraging headlines a productivity challenge threatens to undermine Spain’s long-term prosperity, as highlighted in the recently released 2025 Economic Survey of Spain. Sustained growth and income convergence with other OECD peers depend on accelerating productivity growth and harnessing untapped resources.

Figure 1. GDP growth has surpassed European peers recently

Gross domestic product, volume, seasonally and calendar adjusted data, index 2019Q4 = 100

Source: Eurostat.

Spain is creating jobs faster than most of Europe, and productivity per worker has grown since 2022, notably in  commerce, transport, and hospitality. Despite this improvement, GDP per hour worked in Spain was still 7% below the EU average in 2024 (Figure 2, Panel A). This productivity shortfall isn’t confined to one lagging sector—it affects tradable and non-tradable activities alike, as well as firms of all sizes.

GDP growth will remain robust at 2.9% in 2025, 2.2% in 2026 and 1.8% in 2027, as the expansion of tourism normalizes, and immigration flows moderate. To sustain this growth momentum, and accelerate income convergence, strengthening productivity growth will be key.

The SME opportunity

Small and medium-sized enterprises lie at the centre of Spain’s productivity challenge, and they are equally central to overcoming it. SMEs make up 99% of all Spanish firms and employ nearly two-thirds of the workforce, placing them at the centre of the country’s economic engine. Yet, compared with their counterparts in peer countries, Spanish SMEs tend to be smaller, grow more slowly, and operate at significantly lower productivity levels than OECD top performers (Figure 2, Panel B). These gaps reflect the tighter financing constraints SMEs face, their lower rates of innovation, and the disproportionate regulatory and compliance burdens they bear relative to SMEs in many other European economies.

Aware of these challenges, Spain has launched an ambitious SME agenda backed by the Recovery, Transformation and Resilience Plan, which allocates about 40% of the funds in grants to entrepreneurship, digitalisation, and internationalisation. Yet, more can be done to unlock SME potential:

  • Improving access to finance by strengthening market-based funding channels and connecting small firms with capital market participants, while raising awareness among smaller businesses of available non-bank financing options.
  • Streamlining regulation and administrative procedures costs that weigh heaviest on smaller firms, including phasing-in regulatory thresholds that lead to sudden increases in compliance costs when firms grow.
  • Simplifying application and reimbursement procedures for R&D public support, including by creating a “one-stop-shop” digital platform.
  • Closing skills gaps through more accessible training offers, simplified procedures and better outreach so SMEs can systematically invest in workforce upskilling and reskilling.

When combined, these initiatives can help smaller firms realize their full potential. Even modest productivity gains across thousands of SMEs would translate into sizeable aggregate effects and sustained income convergence.

Figure 2. Despite recent improvements, labour productivity remains below EU

Note: In Panel B, 5 best performers for large firms excludes Ireland and Norway where labour productivity exceeds 416,000 USD in 2023.
Source: OECD Productivity levels Statistics; OECD Structural Business Statistics.

Harnessing the potential of older workers and migrants

The urgency of Spain’s productivity challenge becomes even clearer when demographics enter the picture. An ageing population and low employment rates among older workers (Figure 3) risk reducing labour supply, slowing potential growth, and increasing fiscal pressures, despite supportive tailwinds from rising migration in recent years. Spain faces one of the steepest demographic transitions in the OECD, with the old-age dependency ratio projected to rise by about 41 percentage points between 2024 and 2054. Yet, within these challenges lies untapped potential that can be turned into gains if bold responses are undertaken:

  • Reforming non‑contributory unemployment assistance for over‑52s, which currently acts as a de facto early retirement. This can be addressed by limiting duration, restricting pension accrual to the unemployment insurance phase only, introducing means‑testing and strengthening activation requirements.​
  • Extending working lives by aligning pension incentives more closely with longer life expectancy, while improving working‑conditions and training options for older workers—for example via individual training vouchers co‑funded with employers.​
  • Making better use of migration: foreign‑born workers already represent a large share of recent job creation, but many are overqualified for their jobs. Simplifying and speeding up degree recognition and making migration channels more responsive to labour‑market needs would raise both efficiency and equity.

Figure 3. Raising employment at older ages is central to meet Spain’s demographic challenges

Employment rates by age, %, 2024

Source: OECD Labour force statistics.

The bottom line

Spain’s recent economic performance has been strong. Maintaining this momentum requires shifting gears from job creation to sustained productivity growth. Policy priorities should continue to empower SMEs through better finance and less red tape, activate the older unemployed, extend working lives, and unlock migrant talent. Spain now has a window of opportunity to push ahead with reforms. The choices made in this phase will determine whether today’s resilience becomes tomorrow’s convergence.

References:

OECD (2025), OECD Economic Surveys: Spain 2025, OECD Publishing, Paris, https://doi.org/10.1787/abc5c435-en.


Time for a regulatory reset? Clearing the path for productivity and dynamism

By Dan Andrews, Joana Duran-Franch and Sébastien Turban, OECD Economics Department.

Over recent years, governments across the OECD have expressed concerns that “red tape” is hampering economic activity. Concerns that have been supported by the recent OECD Simplifying for Success survey, in which business organisations report that regulatory requirements and compliance now stand as the most significant challenge for firms, ahead of difficulties in finding workers with the right skills, tax pressures, or geopolitical instability. And crucially, firms perceive that the regulatory burden is mounting over time.

The latest OECD Economic Outlook, in its thematic chapter Time for a Regulatory Reset? (OECD, 2025a), confirms that this is more than a feeling – and that it matters for growth. Labour productivity growth has slowed across most OECD countries since the late 1990s, due to weak business investment (OECD, 2025b) and diminished economic dynamism, which reflects the declining likelihood of new firms to enter and scale-up, workers to change jobs and scarce resources to be reallocated towards more productive firms (Figure 1). Some of this is due to benign forces such as ageing populations or the rise of firm-specific human capital in an intangible-driven economy. But growing regulatory frictions are also part of the story.

Figure 1. Productivity and economic dynamism have slowed down in the last 20 years

Note: In Panel B, the figure reports the average of within-country–industry cumulative changes in percentage points relative to 2004. Estimates are based on data for 12 countries (Austria, Belgium, Finland, France, Germany, Italy, Hungary, Portugal, Slovenia, Spain, Türkiye and the United Kingdom) over the period 2004–2022.
Source: OECD Economic Outlook 118 database; Calvino, F., C. Criscuolo and R. Verlhac (2020); Cho, W. et al. (2024); and OECD calculations.

While regulation is essential, the way we regulate matters for growth and dynamism

Regulations are indispensable for correcting market failures, protecting health and safety, safeguarding the environment and addressing distributional concerns. The question is whether these objectives can be met with fewer distortions and lower compliance costs – freeing up talent and capital for innovation and growth. And there is good reason to believe they can.

The growing regulatory environment has absorbed scarce labour resources

A central contribution of the chapter is to develop a new task-based measure of the real resources used to comply with regulation, as in Trebbi and Zhang (2022) and Trebbi, Zhang and Simkovic (2023). The idea is simple: most jobs include some tasks that are linked to regulation compliance – completing forms, reporting, audits, inspections, ensuring legal or standards compliance, and so on. By identifying these tasks across occupations, we estimate the share of wages and employment devoted to regulatory compliance in OECD countries for which data are available.

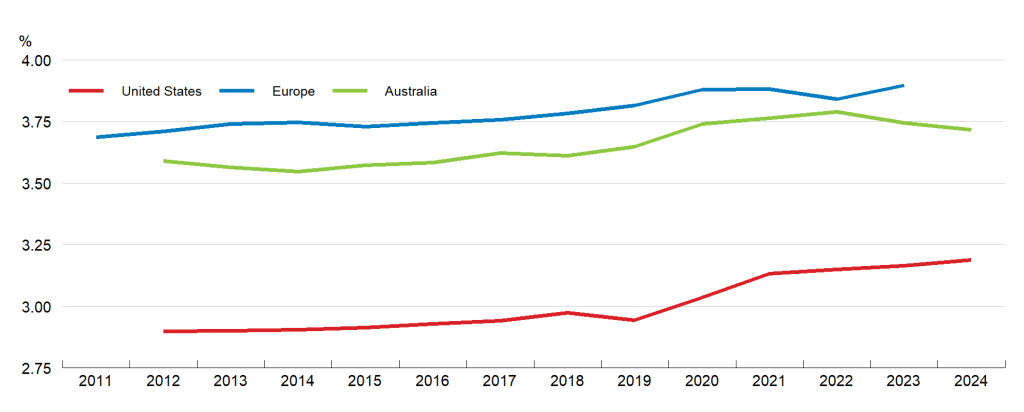
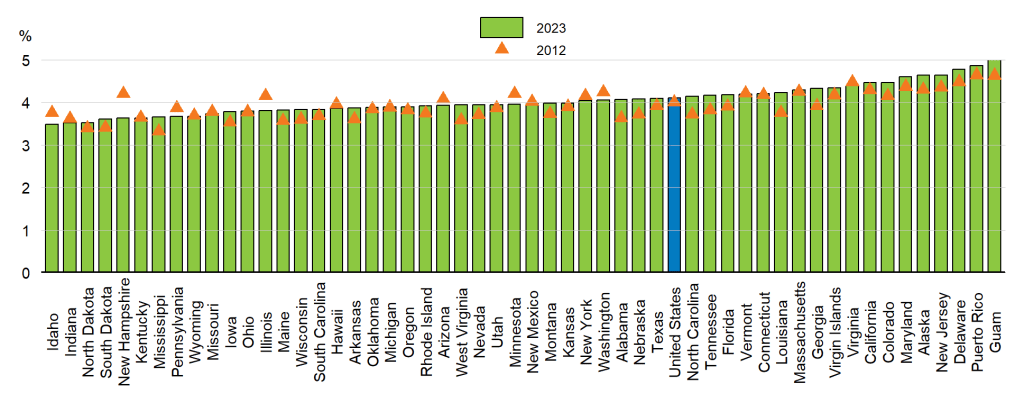
These new measures show that resources devoted to regulatory compliance are significant and growing (Figure 2): In Europe, regulatory tasks accounted for an average of 3.9% of total employment in 2023, up from 3.7% in 2011. This share is higher than in Australia – where the increase has also been smaller over the same period – and notably higher than in the United States, where regulatory tasks account for 3.2% of total employment. In 2024, an estimated 4.2% of the US wage bill was spent on regulation-related tasks (up from 4.0% in 2012), equivalent to around USD 521 billion or 1.8% of GDP. But there is considerable variation across US states, ranging from 3.5% in Idaho to closer to 5% in some states such as New Jersey.   

Figure 2. The share of employment devoted to regulatory tasks has risen in selected OECD countries

A. Share of employment

B. Share of US state and territories’ wages spent on regulatory tasks in 2012 and 2023

Note: In Panel A, the index represents the employment-weighted sum of occupations’ regulation task intensity scores in the three regions. “Europe” refers to the average score of EU countries except Bulgaria, Malta, and Slovenia, and includes the United Kingdom (data available up to 2019), Iceland, Norway, and Switzerland. In Panel B, the index represents a similar, wage-weighted sum. The US unweighted average is in blue. The values for the District of Columbia are not displayed, for readability: the numbers were 7.8% in 2012 and 7.5% in 2023.
Source: Andrews, Turban and Tyros (forthcoming).

When more rules mean less dynamism

Using variation within US states over time, we find that higher regulatory compliance costs are linked to workers producing less per hour and to new businesses making up a smaller share of employment. In detail, long-difference regressions for US states over 2012–2023 show that the average increase in compliance costs is associated with roughly 0.5% lower labour productivity and a 0.4 percentage point drop in the employment share of young firms. The estimates also suggest the effects build up gradually over time. These results are consistent with a growing body of evidence linking regulatory accumulation to slower GDP and productivity growth in the United States, Europe and Australia (Coffey, McLaughlin and Peretto, 2020; Dawson and Seater, 2013; McLaughlin and Wong, 2024; Pellegrino and Zheng, 2023).

Calling for a regulatory reset: Smarter rules for stronger growth

Against this backdrop, the chapter outlines a plan for a “regulatory reset”. While the specific recommendations vary by country – as highlighted by Chapter 3 of the Economic Outlook and explained in a recent blogpost –  a clear common message emerges: this is not about deregulating across the board, but about regulating in a smarter, more dynamic way. The chapter identifies five priorities that governments can act on today:

  1. Simplify and manage regulations systematically. Use non-regulatory tools where appropriate and make regulatory governance more agile and evidence-based. A key step includes managing the stock of regulations through systematic reviews, which currently occur in fewer than one-third of OECD countries (OECD, 2020; OECD, 2025d). Increasing legal certainty and predictability is necessary too: frequent changes, complex drafting, and inconsistent enforcement remain among the top complaints from businesses in the OECD Simplifying for Success surveys.
  2. Make product and labour market regulations more dynamism-friendly. Pro-competitive product market regulation remains a powerful lever for growth, especially in services. Recent OECD evidence suggests that the slowdown in deregulation in network sectors – like energy, transport, and communications – explains up to one-sixth of the post-2005 productivity slowdown. At the same time, easing product market regulations in retail trade and professional services could boost labour productivity significantly. That said, not all regulation harms dynamism and targeted rules can actually enhance it, for example, by addressing the excessive use of non-compete clauses or tightening safeguards against excessive lobbying.
  3. Redesign housing regulation to promote affordability and mobility. Restrictive planning and rental regulations can depress residential construction, push up rents and house prices over time, and reduce labour mobility by locking in tenants. The chapter argues for simpler, more flexible land-use and spatial planning, with fewer barriers to densification and better co-ordination across levels of government, and a gradual phasing-out of strict rent controls.
  4. Regulatory frameworks should harness the productivity benefits of digitalisation and AI. Large-scale AI adoption relies on tangible infrastructure and intangible assets, both shaped by regulation – from data protection and consumer rules to competition and trade policy. The key regulatory challenge is striking the right balance: protecting data without stifling innovation, avoiding fragmented or overlapping rules that raise uncertainty and compliance costs, and ensuring competition and openness in AI markets.
  5. Confront regulatory barriers to energy abundance. As electrification accelerates and AI and data centres push up power demand, renewables have become some of the cheapest sources of new generation. Yet regulatory barriers are slowing investment and deployment (OECD, 2025c). Where these bottlenecks have been tackled – for example through emergency permitting reforms in parts of Europe – renewable deployment has accelerated markedly. The chapter argues for modernising energy regulation to align with decentralised, flexible systems and to make permitting, grid access and remuneration more transparent and predictable.

The bottom line: done well, a regulatory reset can revive economic dynamism and unlock productivity growth, while still delivering on societies’ environmental, social and safety objectives. We should not always regulate less, but we must regulate better.

References

Andrews, D., S. Turban and S. Tyros (forthcoming), “Regulatory compliance costs and productivity: new task-based evidence”, OECD Working Papers.

Calvino, F., C. Criscuolo and R. Verlhac (2020), “Declining business dynamism: Structural and policy determinants”, OECD Science, Technology and Industry Policy Papers, No. 94, OECD Publishing, Paris, https://doi.org/10.1787/77b92072-en

Cho, W. et al. (2024), “Diagnosis and policy action for sustainable and inclusive productivity growth”, OECD Science, Technology and Industry Working Papers, No. 2024/7, OECD Publishing, Paris, https://doi.org/10.1787/1668f250-en.

Coffey, B., P. McLaughlin and P. Peretto (2020), “The cumulative cost of regulations”, Review of Economic Dynamics, Vol. 38, pp. 1-21, https://doi.org/10.1016/j.red.2020.03.004.

Dawson, J. and J. Seater (2013), “Federal regulation and aggregate economic growth”, Journal of Economic Growth, Vol. 18/2, pp. 137-177, https://doi.org/10.1007/s10887-013-9088-y.

McLaughlin, P. and J. Wong (2024), “The Causal Effect of Regulations on Economic Growth: Evidence from the US States”, Mercatus Center Working Paper, https://www.mercatus.org/research/working-papers/causal-effect-regulations-economic-growth-evidence-us-states

OECD (2025), “Simplifying for success: Insights from OECD surveys”, Prepared for the OECD High-level Symposium: 17-18 November 2025, OECD%20S4S%20Symposium%20Brief_Simplifying%20for%20success_Insights%20from%20OECD%20surveys.pdf.

OECD (2025a), OECD Economic Outlook, Volume 2025 Issue 2: Resilient Growth but with Increasing Fragilities, OECD Publishing, Paris, https://doi.org/10.1787/9f653ca1-en.

OECD (2025b), OECD Economic Outlook, Volume 2025 Issue 1: Tackling Uncertainty, Reviving Growth, OECD Publishing, Paris, https://doi.org/10.1787/83363382-en.

OECD (2025c), Diagnostic Toolkit for Reducing Regulatory Barriers to Solar, Wind and Pumped Hydro Storage in European Union: Empowering Policymakers at National, Regional and Local Levels, OECD Publishing, Paris, https://doi.org/10.1787/15f4aed4-en.

OECD (2025d), OECD Regulatory Policy Outlook 2025, OECD Publishing, Paris, https://doi.org/10.1787/56b60e39-en

OECD (2020), Reviewing the Stock of Regulation, OECD Best Practice Principles for Regulatory Policy, OECD Publishing, Paris, https://doi.org/10.1787/1a8f33bc-en.

Pellegrino, B. and G. Zheng (2023), “Quantifying the Impact of Red Tape on Investment: A Survey Date Approach”, SSRN Electronic Journal, https://doi.org/10.2139/ssrn.4593370.

Trebbi, F. and M. Zhang (2022), The Cost of Regulatory Compliance in the United States, National Bureau of Economic Research, Cambridge, MA, https://doi.org/10.3386/w30691.

Trebbi, F., M. Zhang and M. Simkovic (2023), “The Cost of Regulatory Compliance in the United States”, SSRN Electronic Journal, https://doi.org/10.2139/ssrn.4331146