A Response to Queen Elizabeth’s Question on the Global Financial Crisis

Dave Turner, Head of the Macroeconomic Analysis Division, OECD Economics Department

Why did no one see it coming?” was the disarmingly blunt question asked by Queen Elizabeth in the aftermath of the global financial crisis. A number of economists (some with greater reliance on hindsight than others) claimed that there had been “worrying developments” in finance and the global economy for a long time prior to the crisis. Nevertheless, in the eyes of many, the economics profession was damned by the failure of mainstream forecasters, including the OECD and IMF, to predict the crisis. This failure should not, however, have been surprising; forecasters always had a poor track record in predicting economic downturns, particularly because getting the timing right is so difficult [1]. However, they could do a much better job in conveying what those “worrying developments” mean in terms of risks surrounding their forecasts.

Recent OECD research has found that rapid growth in housing-market and credit-related variables can be useful as early warning indicators of severe downturns [2]. These indicators are also correlated with large forecast errors of GDP growth related to (failures to predict) downturns and so can be used to assess the uncertainty surrounding a forecast, distinguishing between a “safe” regime, where forecast errors are expected to be symmetrical, and a “downturn-risk” regime where errors are more likely skewed to the downside [3]. These distributions can then be used to design a fan chart around the central forecast to provide a visual representation of the risks and uncertainties.

What would such fan charts have looked like just prior to the crisis? As an illustration, a series of fan charts are computed around OECD forecasts of GDP growth for the United Kingdom, one of the major economies most severely affected by the crisis. Each fan chart is represented by a series of successively lighter shaded prediction intervals, so that the probability that the outturn lies within successive intervals is assessed at 50%, 70% and 90%.  A first fan chart is constructed as a ‘straw man’, being based on historical forecast errors assuming symmetry in the underlying distribution of errors and ignoring the early warning indicators. On this basis, the outturn for 2009 GDP growth at almost -5% is well outside even a 90% prediction interval on the fan chart (panel A). An alternative asymmetric fan chart (panel B), which takes into account a domestic early warning alarm for rapid credit growth, implies the outturn is closer to, but still outside, the lower 90% prediction limit of about -4%. Thus, perhaps unsurprisingly, to encompass the extreme negative outturn, it is essential to take account of the international dimension of the crisis. Indeed, in the first half of 2008 early warning alarms were flashing for all G7 countries except Japan and Germany. A third fan chart, whereby the skew is calculated on the basis of both domestic early warning alarms and alarms in other major OECD countries, encapsulates the outturn, which falls within the 50-70% prediction interval (panel C). Moreover, similar fan charts computed for other G7 countries confirm that taking into account the early warning alarms, ensures that fan charts are much better at encapsulating the crisis outturn.

Dave

Despite ongoing efforts to improve forecasting models [4], it is likely that forecasters will continue to struggle to predict the timing of future downturns. However, by monitoring credit and housing-market developments and other early warning indicators, they could do a better job of both assessing and presenting the risks surrounding their forecasts. Indeed, perhaps the best possible outcome would be if downturn warnings proved to be false alarms because policy-makers heeded the warnings and took appropriate early action.

Further reading

[1] The following studies provide evidence of the poor performance of all forecasters in predicting downturns:
Abreu, I. (2011), “International Organisations’ vs Private Analysts’ Forecasts: An Evaluation”, Banco de Portugal Working Papers, 20/2011, July.

Fildes, R. and Steckler, (2002), “The state of macroeconomic forecasting”,  Journal of Macroeconomics, 24(2), pp. 435-468.

Loungani, P. (2001), “How accurate are private sector forecasts? Cross-country evidence from consensus forecasts of output growth”, International Journal of Forecasting, 17(3), pp. 410-432.

[2] This paper describes recent OECD work to evaluate the usefulness of early warning indicators of downturns in OECD economies:
Hermansen, M. and O. Röhn (2016), “Economic Resilience: The Usefulness of Early Warning Indicators in OECD Countries“, OECD Journal: Economic Studies, No. 1, Vol. 2016, Issue, 1, pp. 9-35.  OECD Publishing, Paris.

[3] The following paper provides further discussion of the rationale for, and details underlying, the design of the fan charts referred to in this post:
Turner, D. (2017), “Designing Fan Charts for GDP Growth Forecasts to Better Reflect Downturn Risks“, OECD Economics Department Working Papers, No. 1428, OECD Publishing, Paris.

[4] This study draws lessons from the financial crisis which have been, or are in the process of being, reflected in OECD forecasts:
Pain, N. and C. Lewis (2014), “Lessons Learned from OECD Forecasts During and after the Financial Crisis“, OECD Journal: Economic Studies, No. 5, Vol. 2104, Issue, 1, pp. 9-39, OECD Publishing, Paris.

This paper describes the current process of how models are combined with judgement in determining OECD forecasts:
Turner, D. (2016), “The Use of Models in Producing OECD Macroeconomic Forecasts“, OECD Economics Department Working Papers, No. 1336, OECD Publishing, Paris.


Maintaining Switzerland’s enviable living standards into the future

by Christine Lewis, Switzerland Desk, Economics Department

Switzerland’s high living standards and quality of life are renowned. It has the third-highest level of GDP per capita in the OECD. Likewise, survey data show Swiss have the OECD’s second-highest rate of life satisfaction. Unemployment is low, including for young people. And income inequality (after taxes and transfers) is around the OECD average.

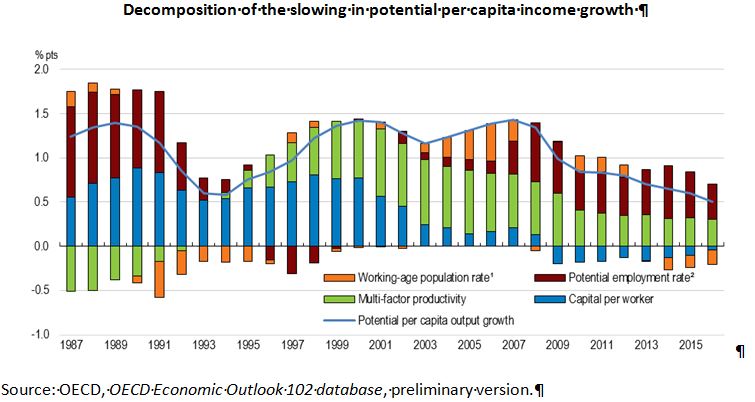
But Switzerland cannot take these enviable outcomes for granted. Indeed, trends are slowly eroding this favourable position. The rate of potential growth in per capita income has slowed to just 0.5%. While Swiss GDP per hour worked was one of was of the highest 40 years ago, growth has stalled due to slow increases in investment and in multi-factor productivity (Figure). Demographics are also playing a role by reducing the share of the population that is of working-age. And immigration, which had helped offset this effect and ease skills shortages, is slowing too. Ageing will add to the fiscal burden: spending on pensions, health and long-term care is projected to increase by 3.5 percentage points of GDP in the next three decades, which risks crowding out other spending and pushing up debt (Federal Department of Finance, 2016).

Switz

The OECD’s latest Economic Survey of Switzerland highlights several win-win policies that can counter these trends by raising labour supply and skills while contributing to the inclusiveness of growth (OECD, 2017):

  • Increasing affordability of childcare would allow mothers to increase their hours if they so choose and help them to maintain a career path. By better allocating women’s skills it would also raise productivity. Likewise, the disincentives in the tax system to take on more hours should be removed by shifting to taxation of individual incomes or undertaking some equivalent measure.
  • Participation in life-long learning should be promoted more actively to ensure that workers continue to maintain and adapt their skills as the economy changes at an ever-faster pace. Swiss workers have high levels of participation in continuing education and training overall, but it is not broad-based with a heavy concentration on those with strong educational attainment. To ensure that other workers are not left behind, subsidies should be offered to workers from groups with low participation rates.
  • Incentivising and assisting workers to delay retirement will help combat the effects of ageing on growth as well as alleviating fiscal pressures. Pension reform is urgently needed to ensure the financial sustainability of the system; reform should raise retirement ages and index them to life expectancy and also include stronger incentives to work longer. Promoting take-up of preventative health programmes, as well as career planning and tailored job-search assistance would lengthen healthy working lives.

[

References

Federal Department of Finance (2016), Report on the Long-term Sustainability of Public Finances in Switzerland, Federal Department of Finance, Bern.

OECD (2017), OECD Economic Survey of Switzerland, OECD Publishing, Paris.


Where to get the best bang for the buck in the United Kingdom? Industrial strategy, investment and lagging regions

by Rafal Kierzenkowski, Head of UK Desk, Peter Gal, Economist, Productivity Workstream, and Gabor Fulop, Analyst at the UK Desk, OECD Economics Department

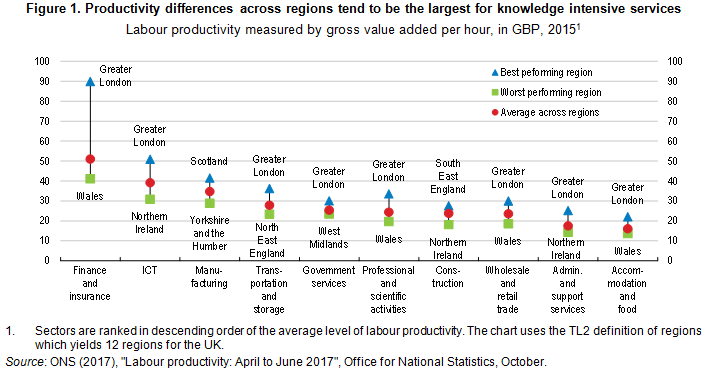
The United Kingdom has large regional disparities in productivity which contribute to differences in living standards across the country, while its less productive regions also hold back overall economic performance (OECD, 2017). High levels of productivity in London are widespread across nearly all sectors, especially among knowledge intensive services such as finance and insurance and information and communication technologies (ICT) (Figure 1).

UKbest bang 11-2017

To narrow these gaps in productivity, the government is preparing a modern industrial strategy to boost labour productivity across the whole country (HM Government, 2017). The strategy has a broad sectoral focus, going beyond manufacturing industries, and aims to improve the local and regional business environment so that both successful businesses and potential new ones can thrive. Devising the optimal strategy raises the question of the optimal allocation of scarce resources in meeting these targets. Our recent study (Kierzenkowksi et al. 2017) aims to contribute to the policy choices linked to the strategy and finds that the catch up of firms with the national best performers in services sectors can give large productivity benefits for most lagging regions, in particular knowledge intensive services such as ICT and business services, but also wholesale and retail trade.

Our study also identifies the sectoral strengths of each region and shows that while each region has productivity leaders, the concentration of such firms is the highest in the south of England, surrounding London, especially in ICT and business services. In turn, differences in the representation of the most productive firms in regions are strongly related to differences in regional productivity.

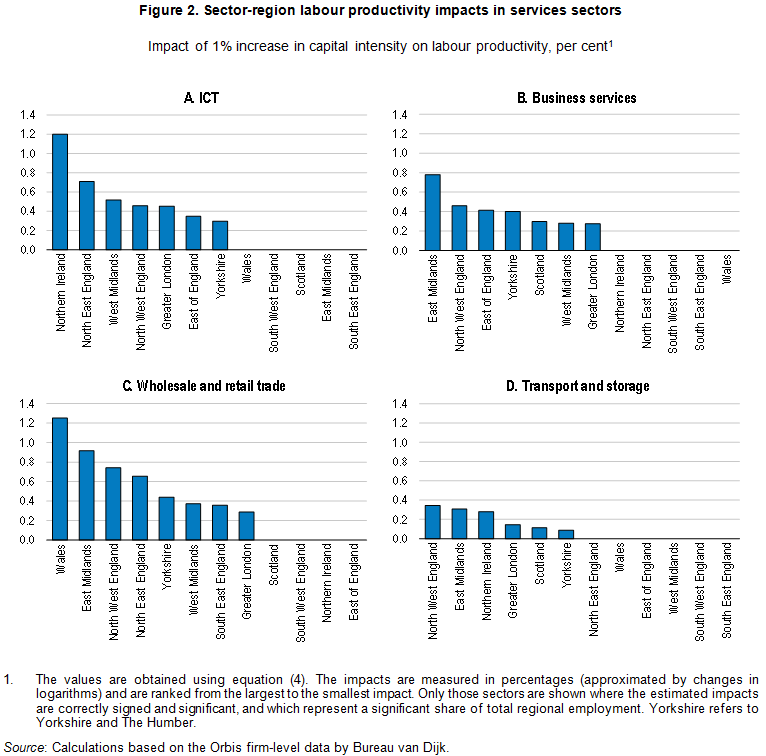
Given low levels of investments in the UK economy and the role new capital goods can play in adopting the latest technologies, our study quantifies the amount of regional and sectoral productivity increases that can be achieved by raising capital intensity. The greatest potential to increase productivity in most regions is by raising the capital intensity of services sectors, which are more responsive to capital intensity increases, in particular in many lagging regions (e.g. northern parts of England, Northern Ireland)  (Figure 2).

UKsectorregion11-2017

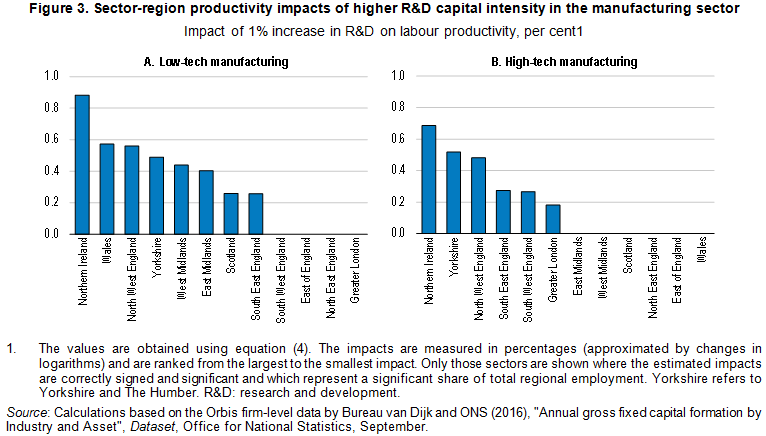
A strong focus on services would also be consistent with the position of UK sectors in global value chains (Criscuolo and Timmis, 2017). However, more granular analysis regarding the type of investment used to raise capital intensity suggests that R&D spending could be effective in raising the productivity of the manufacturing sector in some regions (Figure 3).

UKprod11-2017

Of course, there are several complementary factors to capital intensity that are likely to play a key role in boosting productivity of lagging regions but which can be harder to take into account in a systematic, quantitative manner. Key among them is the availability of skills and their matching to jobs, especially given that regional job-to-job mobility is likely to be held back by a low price elasticity of housing supply. In addition, the ecosystem of companies including the role of infrastructure as well as the density of consumers and suppliers are also likely to play a crucial role.

Bibliography

Criscuolo, C. and J. Timmis (2017), “GVCs and centrality: mapping key hubs, spokes and the periphery”, OECD Productivity Working Papers, forthcoming.

Cohen, W. M. and D. A. Levinthal (1989), “Innovation and Learning: The Two Faces of R & D”, The Economic Journal, Vol. 99, No. 397.

HM Government (2017), Building our Industrial Strategy, Green Paper.

Kierzenkowski, R., P. Gal and G. Fulop (2017), “Where to get the best bang for the buck in the United Kingdom? Industrial strategy, investment and lagging regions”, OECD Economics Department Working Papers No. 1426

OECD (2017), Economic Suvey of the United Kingdom, OECD Publishing, Paris


Reducing inequality to raise incomes and expand well-being for all Colombians

By Christine de La Maisonneuve, Economist on the Colombia desk, Economics Department

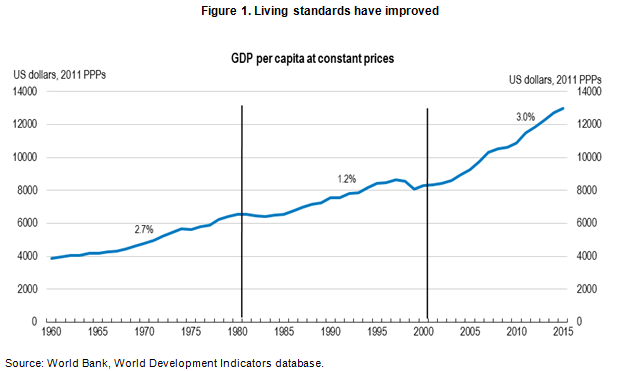
Growth has become more inclusive in recent years. Living standards have improved and poverty has declined (Figure 1). However, the gap between rich and poor remains among the highest in Latin America. The peace agreement will boost economic growth, but to share it fairly Colombia must also achieve better educational outcomes and bring more people into the more productive formal economy.

Colombiaoct2017

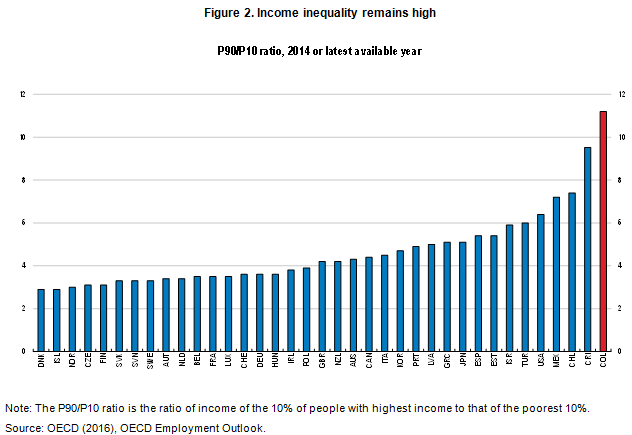
One of the key challenges facing Colombia is the creation of better quality jobs. Although the economy has grown strongly for some time, income and regional inequalities remain important (Figure 2). Informality is high in the labour market and keeps more than half of the workers in marginal, insecure, low paying jobs without access to social benefits. The earnings gap between formal and informal workers is significant. The Colombian authorities have promoted the formalisation of labour over the past decade. In particular, the tax reform of 2012, which reduced non-wage labour costs by eliminating some labour taxes led to a significant increase in formal job creation. To reduce informality more, focus should be placed on further reducing the non-wage labour burden on wages; and simplifying the complex procedures for the registration of companies and the affiliation of workers to social security.

Colomboct2017

Despite significant progress in reducing gender inequalities in education and providing more opportunities for women to develop their careers, gender employment and wage gaps still remain; in particular for low-income, low-educated and rural women. Greater and more affordable child, elderly and disability care could open the job market to more women. Colombia should also increase investment in active labour-market policies such as training to reduce the gender gap in labour market participation.

A key ingredient to enhance inclusive growth is to raise the quality of education at every level, starting in pre-primary. The performance of the education system has improved in recent years as shown by the new PISA results (an internationally standardised test for 15 year olds). Colombia has made impressive gains in expanding access to education but the quality is still highly unequal and too many students leave education without the basic skills they need to succeed in life and work. Raising the quality of teaching will be vital to improve student learning.

The social system could also redistribute more. Public social spending has increased remarkably since the 1990s due to commitments in the Constitution and greater decentralisation of public expenditure. Nonetheless, social spending remain low relative to GDP and compared to the OECD average, are not always well targeted and have a very limited redistributive impact. The pension system leaves many elderly in poverty. The high level of informality and stringent eligibility requirements generate a low coverage especially for women and lower-skill workers. The government provides old-age income support for the poor through Colombia Mayor but coverage and benefits are too low. A reform of the pension system is needed to extend coverage and increase the elderly well-being.

Health coverage is almost universal. Out-of-pocket payments have substantially declined and almost all citizens have access to an equal basket of services whether they are in formal or informal employment. However, access to quality services remains difficult for the poor and in rural areas. Given the remoteness of many areas in Colombia, poor availability of health centres and health professionals, deficient transportation and high transportation costs make it challenging to ensure an adequate standard of care quality in all regions. Consequently, health outcomes differ across regions. A different delivery and financing model is needed in rural and remote areas to achieve levels of access and quality that are comparable to advanced urban settings. This will require forging a sustained service network between rural and urban health care providers.

Bibliography

De la Maisonneuve, Christine (2017), Towards more inclusive growth in Colombia, OECD Economics Department Working Paper no 1423.

OECD (2017), Economic Surveys: Colombia 2017, OECD Publishing, Paris.


The Slovenian economy is bouncing back

by Rory O’Farrell, Slovenia Desk, OECD Economics Department

Slovenia would do well if its economy performed as well as its ski-jumpers. In 2015, Slovenian Peter Prevc became the first ski-jumper in history to jump 250 metres. As impressive has been his ability to land successfully, being among the few jumpers to receive a perfect 20 points for style. While the Slovenian economy has been successful in bounding forward, it has taken hard falls in the past, and a lack of resilience means it has taken a long time to recover.

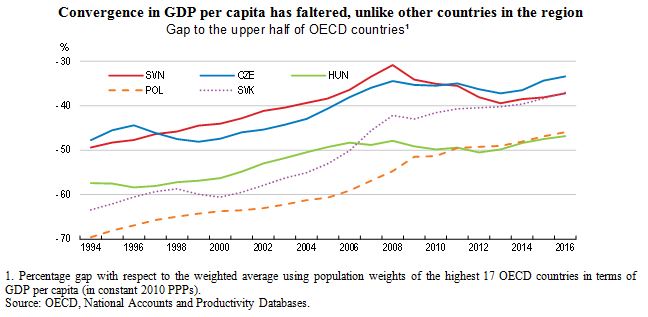
Prior to the international crisis, the bounding Slovenian economy converged with advanced OECD economies, before suffering a double hard landing with the onset of the international financial crisis and a subsequent domestic banking crisis. However, thanks to recent structural reforms, business restructuring, supportive monetary conditions and improved export markets, Slovenia is leaping forward again. GDP growth is accelerating and broadening, unemployment is down, and both consumer confidence and the trade balance are reaching record highs. The government may need to step in early with tighter fiscal policy to ensure a controlled landing.

Slovenia

However, unlike its agile youthful ski-jumpers, Slovenia is not breaking any records in terms of productivity. Indeed, its growth has lagged that of regional peers. Labour productivity is low compared to the OECD average, in part due to large numbers of workers employed in relatively low-productivity small firms, and this has yet to show a strong improvement. Productivity gains were also held back by low investment, as the crisis-afflicted banking sector was unable to lend to domestic firms, and Slovenia has been less succcesful in attracting foreign direct investment than other countries in the region. In addition, a lack of competitive pressure, due to heavy regulation and ineffective competition policies and enforcement, has inhibited Slovenian firms from developing the efficiency needed to drive productivity forward.

The nimbleness of the Slovenian economy is also being reduced by a rapidly ageing population. Older workers with obsolete skills have tended to take early retirement rather than retrain, and a poor reallocation of labour is leading to labour shortages. In the past such shortages were filled by training young Slovenians, but a shrinking youth population means this is no longer possible. In addition, public spending pressures due to ageing (in terms of health and pensions) are mounting.

However,  with an improving economy Slovenia is in a good position to move ahead with reforms that will boost long-term growth. As with any ambitious endeavour, occasional mishaps are inevitable. The just released OECD Economic Survey of Slovenia highlights the need to maintain a fiscal cushion to soften future landings as well as the reforms needed to create a more agile economy to sustain incomes and well-being.

Find out more:

OECD (2017), OECD Economic Surveys: Slovenia 2017, OECD Publishing, Paris.


Retraining can enable ageing Slovenians to keep pace with new technologies

by Rory O’Farrell, Slovenia Desk, OECD Economics Department

While workers in many OECD countries are worried whether robots will take their jobs, the inhabitants of the Slovenian town of Kočevje are less concerned. In 2016 Japanese robotics firm, Yaskawa, announced plans to produce robots in Kočevje, which could create up to 200 jobs. This is a continuation of a pattern seen since independence whereby Slovenia has continued to shift from traditional manufacturing to business services and high-tech production. However, not all Slovenians have been included in this progress.

Modernisation has mainly been achieved by training young Slovenians to fill new occupations. In contrast, those with obsolete skills tend to retire or become unemployed rather than retrain, leaving Slovenia with persistent long-term unemployment, and amongst the lowest employment rates of older workers in the OECD. An ageing population means this is no longer sustainable, and labour shortages are already emerging. To meet the need for skills that complement investment in knowledge-based capital, and the new technologies brought by foreign firms, more responsive education and training solutions are needed.

Slovenia

Slovenia performs poorly in terms of providing workers the opportunity to retrain later in life. While it has an effective system of vocational education, workers lack some basic skills that enable them to retrain later in life. Also, although tertiary attainment has increased rapidly, high fees for part-time students make it unattractive for older Slovenians to pursue tertiary education. There is also a lack of incentives to retrain, as wages rise automatically with age and thus do not reflect the relative demand for different occupations, and unemployment and disability insurance have served as pathways to early retirement.

The just-released OECD Economic Survey of  Slovenia outlines how a more flexible education and training system can help create a more flexible labour market. Policies such as greater problem-based learning for vocational students, more adult training, and equalising fees for part-time and full-time students can help workers adapt to future changes in the labour market. This can help ensure all Slovenians benefit from future economic growth.

Find out more:

OECD (2017), OECD Economic Surveys: Slovenia 2017, OECD Publishing, Paris.


Mitigating the negative economic impact of Brexit

by Rafal Kierzendowski, Mark Baker, Pierre Beynet and Gabor Fulop, UK Desk, OECD Economics Department

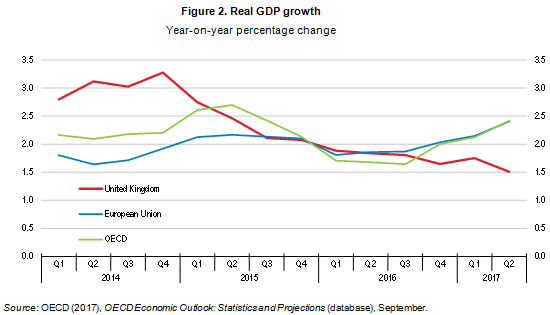
Ahead of the referendum on Brexit, the OECD had been anticipating a significant decrease in economic growth if the decision to leave the EU were taken (Kierzenkowski et al., 2016). As the UK economy has started to slow down, OECD simulations remain remarkably valid so far (Figure 1).

UK

British growth was ahead of G7 economies one year ago, but has now fallen behind as other advanced economies have continued to recover (Figure 2). The recent OECD economic survey on the UK (OECD, 2017) analyses which channels Brexit prospects are currently hurting the economy and what could be done to mitigate this impact.

Fig2UKlaunch

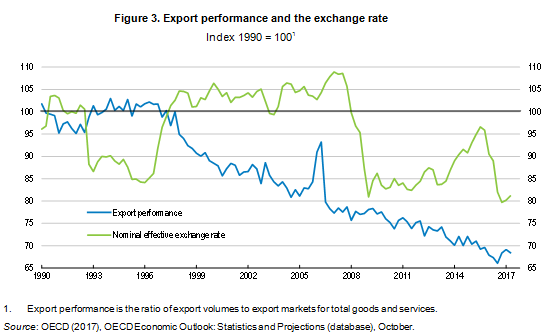
The sterling’s depreciation has been a major drag on growth. It has pushed consumer prices up and hurt household consumption by reducing purchasing power. As real incomes have fallen, households have for a while supported their consumption by reducing their savings. However, the saving ratio increased in the second quarter and consumer credit growth may have peaked. Car registrations are subdued since April.

The sterling’s depreciation has also cut corporate margins of domestic producers, reducing the ability of non-exporting firms to finance investment. In addition, business investment growth has weakened as economic policy uncertainty is high. Weak demand should also negatively weigh on investment of domestically-oriented firms: this is the second-highest risk cited by around half of businesses, with the effects of Brexit being the top risk for nearly 60% of them (Deloitte, 2017).

The depreciation of the pound should support export-oriented firms, but this might not be sufficient to offset the negative factors mentioned above. History indicates that British exports have had a low responsiveness to exchange rate movements and the UK’s export performance has been in fact falling over the last two decades (Figure 3). This could be due to increased participation in global value chains, implying a high import content in exports, reducing scope for exporters to win market share following currency depreciation. Moreover, exporters who rely less on imports tend to increase their margins following a depreciation, preventing them from gaining market shares.

Fig3UKlaunch

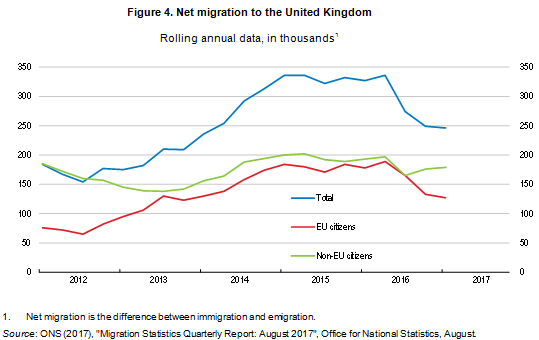
Immigration has enhanced living standards by expanding the labour market and by having a positive impact on labour productivity. Following the EU membership referendum in mid-2016, there has been an important fall in net migration, mainly of EU citizens, explained by increased emigration and reduced immigration (Figure 4). Declines in net migration could tighten the labour market if labour supply falls faster than labour demand. It will significantly reduce growth eventually.

Fig4UKlaunch

In this context, the recent OECD economic survey recommends that the UK authorities secure the closest possible economic relationship with the European Union in its future trading arrangement. Rapidly concluding negotiations to guarantee the rights of EU citizens is a priority to sustain labour supply and ensure further progress in living standards. The United Kingdom should adopt simple criteria to deal with EU citizens living and/or working in the United Kingdom, which would minimise administrative burdens and avoid that some categories of EU citizens fall into the cracks, such as cross-border workers. The government should also identify in advance productivity-enhancing fiscal initiatives on investment that can be implemented swiftly should growth weaken significantly ahead of Brexit. A detailed evaluation of polices to offset the possible loss of European structural funds to poorer UK regions will also be necessary to avoid exacerbating existing regional economic disparities.

Bibliography

Deloitte (2017), Deloitte CFO Survey: 2017 Q2, July.

Kierzenkowski, R., et al.  (2016), “The Economic Consequences of Brexit: A Taxing Decision“, OECD Economic Policy Papers, No. 16, OECD Publishing, Paris.
http://dx.doi.org/10.1787/5jm0lsvdkf6k-en

OECD (2017), OECD Economic Surveys: United Kingdom 2017, OECD Publishing, Paris. http://dx.doi.org/10.1787/eco_surveys-gbr-2017-en


Statistical Insights: What does household debt say about financial resilience?

Stat-Insights-200_fw


by Isabelle Ynesta, Financial Statistics Statistician and Matthew De Queljoe, Statistician, OECD Statistics Directorate

Household debt levels increased rapidly in many economies in the run-up to the 2007-2008 financial crisis, fuelled in part by easy credit and rising property prices. Ratios of debt to annual income – used by lenders to determine households’ repayment capacity – then reached record highs across OECD countries. These debt levels have since continued to rise in most OECD countries, albeit at a much slower pace, both in real terms and as a multiple of annual disposable income. What does this say about households’ financial resilience?

Household indebtedness ratios have trended up since 2000, but the rise has slowed considerably since 2007 in most OECD countries 

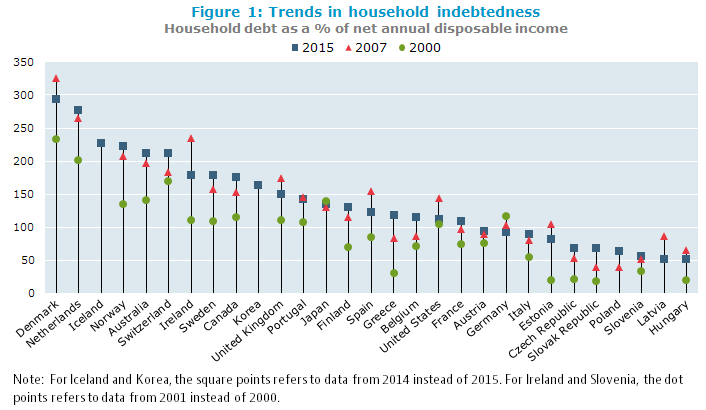
Household indebtedness ratios have been trending up since 2000 in nearly all OECD countries, with the notable exceptions of Japan and Germany. Most of the accumulation of debt occurred in the run‑up to the financial crisis, in the period 2000-2007, when households increased their borrowings in response to greater access to credit and increasing house prices, most spectacularly in Ireland where indebtedness went from 111% of annual disposal income in 2001 to 234% in 2007 (figure 1). Following the crisis, the increase in indebtedness slowed considerably in many OECD countries, and even reversed in some of them, as households redeemed their debt and limited new borrowings. The sharpest falls were in Ireland (down 56 percentage points from 2007), Latvia (down 34 percentage points), Spain (down 33 percentage points), Denmark (down 32 percentage points), and the United States (down 31 percentage points).

StatI1Sept2017

Loans, predominantly mortgage loans, make up the largest component of household debt. When real estate prices increase, households must borrow larger amounts to buy a house. Existing homeowners may also feel richer and borrow against their increased collateral to fund spending on consumer goods and services (Statistical Insights: Blowing bubbles? Developments in house prices). Both phenomena were observed in countries where housing bubbles occurred, and contributed to increasing household debt levels in countries such as Denmark, the Netherlands, Spain, the United States, and the United Kingdom.

On the other hand, Japan and Germany did not experience housing booms and their household debt levels fell over the period 2000-2015. Japanese households tended to accumulate large down‑payments before borrowing to buy a house, and existing owners did not extract equity from their houses by increasing their mortgages. In Germany, a key factor is a low home ownership rate relative to other OECD countries.

Household indebtedness ratios can vary widely across countries

Figure 1 also shows that Danish households had the highest indebtedness ratio in 2015 at 293% of annual disposable income, followed by the Netherlands at 276%, whereas Hungary had the lowest at 51% (figure 1). These ratios, however, may not be the best measure of households’ financial resilience, which must also take account of factors such as the level of interest rates, whether mortgages are at fixed or floating rates, and whether tax breaks apply to mortgage interest. In the Netherlands, for example, households can deduct interest paid on mortgage loans from their taxable income, which may partly explain why Dutch mortgages are among the highest in Europe in relation to the value of the underlying collateral.

But to better understand households’ financial resilience assets matter too

To gain a better understanding of households’ vulnerability to economic shocks – such as becoming unemployed – one should also look at the assets they have available to pay down debt. Clearly, having a low debt-to-assets ratio will increase households’ resilience to shocks. However, the assets side of the ratio can be significantly affected by how pension systems work in various countries. Where future pension liabilities are already funded, this will increase households’ assets. This is the case in the Netherlands and Australia, where funded pension schemes are well developed, and pension assets represented 60% and 56%, respectively, of households’ total financial assets in 2015. At the other end of the spectrum, Belgian households’ pension assets only accounted for 6.5% of their total financial assets, since most pensions are funded on a pay-as-you-go system.

Household debt-to-assets ratios rose after 2000 in most OECD countries,
but the picture is mixed since 2007

StatISept2017

The debt-to-assets ratio in 2015 for Denmark, the Netherlands and the United States, countries that experienced a housing bubble, was more or less the same as in 2000 and around 5 percentage points less than in 2007. On the other hand, the debt-to-assets ratio increased considerably between 2000 and 2015 in the Slovak Republic, Greece and Estonia, although from a low base. In the Slovak Republic, the easing of credit restrictions, and the launching of mortgage banking in 2000, made loans more readily available. Since 2007 the debt-to-assets ratio has continued to increase in the Slovak Republic and Greece whereas it fell in Estonia. Household financial resilience depends on the distribution of assets, liabilities and income and the institutional factors prevailing in each country, but in general, debt-to-assets ratios that are trending up indicate that households are becoming less resilient to shocks.

A final remark concerns the distribution of assets and debt. While a country’s average numbers may look comforting, the distribution of assets and debt could be skewed, making certain groups in society very vulnerable to various types of economic shock. The OECD therefore invests considerable effort in obtaining information broken down by various household groups. Preliminary results of this work can be found in “Measuring inequality in income and consumption in a national accounts framework, OECD Statistics Brief, November 2014 – No. 19″ and “Household wealth inequality across OECD countries: new OECD evidence, OECD Statistics Brief, June 2015 – No. 21″.

The measures explained

Household net disposable income: Total annual income received by households after deducting taxes on income and wealth and social contributions, and including monetary social benefits (such as unemployment benefits). This measure thus represents the amount left at the disposal of households for either consumption or saving. It is called “net” because amounts needed to replace capital assets (dwellings and equipment of unincorporated enterprises) are already deducted.

Household indebtedness ratio: Households’ total outstanding debt divided by their annual net disposable income. The debt of households largely consists of loans, primarily home mortgage loans, but also other types of liabilities such as consumer debt (e.g., credit cards, automobile loans).

An indebtedness ratio above (below) 100 percent indicates that the household debt outstanding is larger (smaller) than the annual flow of net disposable income.

Household debt-to-total-assets ratio: Households’ total outstanding debt divided by their total assets. The total assets of households consist of both financial assets (saving deposits, shares and other equity, pension entitlements etc.) and non-financial assets (predominantly residential real estate including both dwellings and land, though due to data limitations, only the value of dwellings is included in the figures shown here).

The higher (lower) the debt-to-total-assets ratio, the higher (lower) is the level of households’ leverage, and the weaker (stronger) is their financial position.

Where to find the underlying data?

  • Financial Dashboard: this dataset contains data on households’ financial wealth and on households’ debt
  • Household Dashboard includes indicators related to the household sector published on a quarterly frequency

Household annual and quarterly financial accounts and financial balance sheet data can be found at:

Annual data

Quarterly data

Further reading


Contact: for further information, please contact the OECD Statistics Directorate at stat.contact@oecd.org.


Improving life in France’s poor neighbourhoods

by Nicola Brandt, France Desk, Country Studies Branch, OECD Economics Department

While overall poverty is relatively low in France, it can be highly concentrated at the neighbourhood level. In some cases the income of up to 40% of households in such neighbourhoods falls short of the relative poverty line. Unemployment is high, many children struggle in school, housing and urban infrastructure is run down, and there is a lack of local employers, public and private services, and amenities. The French government targets education, employment, business and safety measures specifically at these areas. There are also dedicated policies to promote social mixing: municipalities in areas with tensions on the housing market have to reach a social housing share of at least 25% or face fines. A large-scale urban renovation programme aims to attract the middle class to poor neighbourhoods and re-locate some of their inhabitants in wealthier areas when dilapidated social housing estates are demolished and smaller units with a mix of tenures are built on their sites. Such policies are based on the idea that there can be neighbourhood effects, whereby a high concentration of poverty would reinforce and reproduce economic and social disadvantage. Indeed, in the United States children who moved away from neighbourhoods with a high concentration of poverty have been found to attain higher levels of education and earnings than their peers who stayed behind (Chetty et al., 2016; Chetty and Hendren, 2015).

While these results do not necessarily carry over to the French context, as poverty overall is much lower than in the United States and the social safety net is stronger, there is clear evidence that social disadvantage is reinforced for inhabitants of France’s poor neighbourhoods. Their unemployment risk can almost double compared to individuals with comparable characteristics who live in wealthier neighbourhoods (Figure 1). Studies show that this is partly due to discrimination – chances to be invited to an interview simply fall when a CV features a foreign-sounding name or an address in a poor area (Bunel et al., 2016; Petit et al., 2016). Another issue is that many poor neighbourhoods are remote and poorly connected to transport infrastructure and services. This is particularly true at unusual hours, which are more common among low-qualified workers. At the same time they are less likely to have a driver’s license or own a car. The recently released OECD Economic Survey of France concludes that active policies are needed to fight discrimination. This can include awareness campaigns for recruiters as well as mentoring and coaching for candidates to put them into direct contact with employers, which has proven to work well for university graduates.

Franceneighbourhoods1

The urban renovation programme has improved infrastructure, and many inhabitants are satisfied with the results, but the impact on social mixing is more questionable. Echoing the experience from other countries many inhabitants have been relocated to other high-poverty neighbourhoods. Moreover, mixing tenures is no guarantee for more social interaction (Posthumus et al., 2013; Lelévrier, 2013a and b). As the government plans to extend the programme the Economic Survey recommends to better integrate it with employment and social policies. Consultation with inhabitants about the planned projects should be used as an entry point to offer basic skills and language training. Renovation works themselves would be an opportunity to offer apprenticeship-style training for building sector jobs. Indeed, consultation needs to improve, and citizen councils introduced in 2014 to help to draft strategy documents for the economic and social development of poor neighbourhoods are a first step in that direction. Strong resident participation in designing and implementing renovation projects has been successfully practiced in Germany (Blanc, 2010), where self-directed rehabilitation is a common model, and more recently the United States (Kirszbaum, 2013), where residents of demolished sites now have a right to return.

France has run priority education programmes to devote more resources to schools with many disadvantaged pupils for more than 30 years, but the impact of socio-economic background on learning outcomes is still among the highest in the OECD (Figure 2). The OECD Economic Survey of France argues the introduction of various measures to enhance individualised support for struggling students has suffered from a lack of high-quality initial and continuing pedagogical training for teachers to ensure effective implementation. More has to be done to offer attractive pay and career prospects for teaching in schools with many disadvantaged children to attract and retain excellent teachers. While the premium for teaching in priority education schools has recently been lifted, it remains too low to stabilise teaching teams, and, until recently, some advantages for teachers in those schools actually helped them to leave faster, creating perverse incentives.

France2neighbourhoods1

Presentation: What policies for poor neighbourhoods?

quartiers defavorises

This discussion will be introduced by the author on  Friday 13 October at 9h30 at the Université Paris-Est Marne-la-Vallée.  A round table discussion will follow the presentation. The event is open to the public, for more information: http://www.tepp.eu/conferences/ contacts : samir.mellal@u-pem.fr‌

Bibliography

Blanc, M. (2013), “La gouvernance participative et la rénovation urbaine en Allemagne et en France”, 6èmes Rencontres du Réseau transfrontalier ’Participation Grand Est’, Strasbourg.

Bunel, M., Y. L’Horty and P. Petit (2016), “Discrimination based on place of residence and access to employment”, Urban Studies, Vol. 53, No. 2, pp. 267-86.

Chetty, R. and N. Hendren (2015), “The impacts of neighborhoods on intergenerational mobility: childhood exposure effects and county-level estimates”, https://scholar.harvard.edu/files/hendren/files/nbhds_paper.pdf.

Chetty, R., N. Hendren and L. Katz (2016), “The Effects of Exposure to Better Neighborhoods on Children: New Evidence from the Moving to Opportunity Experiment”, American Economic Review, Vol. 106, No. 4, pp. 855-902, April.

Kirszbaum, T. (2013), “Rénovation urbaine et équité sociale: Choice Neighborhoods aux Etats- Unis”, [Rapport de recherche] ISP; CNRS; Commissariat général à la stratégie et à la prospective; secretariat général du Comité interministériel des villes.

Lelévrier, C. (2013a), “La mixité dans la rénovation urbaine : dispersion ou re-concentration”, CAIRN Info, Paris.

Lelévrier, C. (2013b), “Social mix neighbourhood policies and social interaction: The experience of newcomers in three new renewal developments in France”, Cities, Vol. 35, pp. 409-16.

Petit, P., M. Bunel, E. Ene and Y. L’Horty (2016), “Effets de quartier, effet de département ; discrimination liée au lieu de résidence et accès à l’emploi”, Revue Économique, Vol. 67, pp. 525-50.

Posthumus, H., G. Bolt and R.Van Kempen (2013), “Why do displaced residents move to socioeconomically disadvantaged neighbourhoods?”, Housing Studies, Vol. 28, No. 2, pp. 272-93.


Italy’s justice system has quite a long road ahead but already scores better – The Italian View

by the Italian Ministry of Economy and Finance – Pier Carlo Padoan, Italy’s Minister of Finance, was OECD Deputy Secretary-General and Chief Economist from 2009-2014).

Italy’s justice system is gaining greater efficiency, thus gradually closing its paradoxical gap. On the one hand, the clearance rate (measured as the ratio of the number of resolved cases to the number of incoming cases) is 120% and Italy ranks second in the European Union after Slovakia. On the other hand, Italy ranks last for the average length of civil or commercial proceedings, because of the huge backlog that weighs on courts and slows down the wheels of justice. Disposition time decreased by 13% in two years, but it still is as high as 527 days compared with a European average of 248 days. In 60% of Italian courts 1 out of 5 cases has been pending for more than 3 years, thus exceeding the “reasonable time” envisaged in the Pinto law of 2001. As priority will be given to recent cases, disposition time in courts that have a bigger backlog will lengthen. The longer a legal case remains unsettled, the longer the court will take to reach final disposition. The total backlog of civil cases has decreased by 4% from 2015 to 2016 and by a significant 34% from 2009. Nonetheless, the total civil and commercial litigious cases backlog was still as high as 4,400 cases pending (1st instance/ per 100,000 inhabitants) in 2005, 2.6 times higher than the EU average. Court performance varies geographically. Sicilian courts have a backlog of cases 50% of which have been pending for more than three years and less than 10 or 15% of which have been pending for more than three years.

With €4.8 bn of public expenditure, Italy is still the third biggest spender in the EU after Germany (€9.6 bn ) and the UK (€6.6 bn). Despite the crisis, total expenditure increased by 4.2% a year from 2006 to 2016. Better performances are not just a matter of increasing staff levels. Evidence published by the CSM (Consiglio Superiore della Magistratura – the High Council of the Judiciary) shows no correlation between staff shortages and poor performance, at least in conditions of relative and temporary lack of resources. With 1,75 million new legal cases per year, litigation rates in Italy are now in line with the EU average.

Efficiency gains have been achieved thanks to the far-reaching reorganization of the Italian judicial system and the adoption of new best practices in case management. First, e-filing has continued since its introduction in 2014. E-filing of notices increased by 6.7% over 2016, increasing savings by 10% and speeding up the issuing of digital payment orders by over 50% in some districts. E- filing by lawyers and professionals increased by 12% last year (after a first +88% in 2014/15), increasing the average e-files stock by 50% over the last three years.

Alternative dispute resolutions (ADR) contributes to unburdening courts in terms of dispute settlements. ADR includes referral to arbitration, negotiation assisted by a legal counsel (outof- court settlement procedure) and civil mediation. On average around 186,000 civil mediation processes have been initiated each year since 2014. The last two years have seen an increase in filings, followed by more than 30% increase in the number of judgments pending. This has slowed down resolution time from 83 days in 2013 to 115 days in 2015, which remains considerably shorter than that of in-courts settlements; however, a further increase, would affect the effectiveness of the process. The most evident reduction has been observed in commercial litigation, whose disposition time decreased from 40 to 29 months. Figures show that the older and more complex cases are now being settled, thereby contributing to rendering the justice system fairer. Specialization also helps in better managing the workflow. Since their introduction in 22 provinces in 2012, business courts have performed well. They deal exclusively with cases involving industrial property, company law, public contracts and services and European Union public work contracts. The number of resolved cases increased from an initial 404 to over 5,600 at the end of 2016. The increase in registrations raised resolution time: in 2016 the percentage of disputes which took less than a year to be resolved fell to 57% from 74% in 2014. Predictable outcomes and the number of confirmed rulings remain high, which reflect the quality of pronouncements and the effectiveness of judges and prosecutors’ specialization. In Milan verdicts are confirmed in 70-80% of cases.

Alternative dispute resolution is accompanied by measures to discourage initiation of proceedings when unneeded (i.e. no more free appeal proceedings before Justices of the Peace after administrative sanctions have been imposed) and the introduction of a formula to determine attorney fees (together with the possibility of requesting quotes). These rules contributed to decrease the demand for judicial services (civil and commercial cases), from 4 to 2.5 (1st instance/ per 100 inhabitants) between 2010 and 2015. However, the drop may also be ascribed to the economic crisis (a low GDP means fewer filings).

There is a positive correlation between economic growth and a healthy, efficient, fair judicial system. This is an even more important aspect especially during an upswing such as the one Italy is now experiencing. Lengthy proceedings and high enforcement create a climate of uncertainty and skepticism which affects the business environment and keeps investors away from opportunities. Given the same infrastructure and initial business conditions, evidence has shown that differences in the efficiency of judicial systems at provincial level can determine a difference in turnover of €31 K – or 8% of turnover – for an average Italian medium-sized company. A few years ago ECB President Mario Draghi stated that the cost of Italy’s slow judicial system accounts for over 1% of GDP. Gains in efficiency remain a top priority for the Government, which keeps working on reforms to speed up digitalisation and increase the overall effectiveness of the justice system.

Italian View