Strengthening Romania’s competitiveness

Romania has made remarkable progress in converging toward OECD income levels over the past two decades, supported by deeper integration into global markets, substantial capital inflows, and wide‑ranging economic reforms.

by Katja Schmidt, OECD Economics Department


Romania has made remarkable progress in converging toward OECD income levels over the past two decades, supported by deeper integration into global markets, substantial capital inflows, and wide‑ranging economic reforms.

These forces have driven strong productivity gains (Figure 1), bringing labour productivity close to the OECD average. Yet significant untapped potential remains. Further boosting the productivity of domestic firms and integrating them more deeply into global markets would raise the domestic value‑added content of production and help the country move up the value chain. At the same time, realigning wage dynamics more closely with productivity growth – which wages have outpaced in recent years – will be essential to safeguard competitiveness and support sustained improvements in living standards.

The new 2026 OECD Economic Survey of Romania highlights four key priorities to increase the integration of domestic firms into global markets while supporting broader productivity gains:

  • Strengthening innovation capacities and digital intensity among domestic firms
  • Promoting human capital development and skills
  • Improving the business environment and market efficiency
  • Fostering infrastructure development.

The innovation gap remains wide compared with both OECD and regional peers. Domestic firms continue to exhibit low rates of product, service, and process innovation, as well as limited R&D investment (Figure 2). Closing this gap requires measures to strengthen firms’ innovation capacities – for example, by simplifying access to R&D tax incentives and raising awareness of their availability. Innovation among SMEs could be further supported by making R&D tax incentives more effective, including through refundability so that any credit exceeding the tax liability is paid out in cash, and by establishing well‑defined public-private project opportunities that encourage SME participation in R&D. In parallel, improving firms’ access to finance and advancing financial deepening – including through more developed capital markets – will be essential to enable productivity‑enhancing investment, foster innovation, and support firm growth and scaling.

Romania’s digital infrastructure has improved significantly: access to high‑speed broadband is now approaching levels seen in the best‑performing OECD countries. However, digital intensity and the use of digital technologies by firms remain low. This reflects relatively low digital skills in the wider population, which should be strengthened as a priority. Awareness of and access to digital advisory and support schemes could also be improved. Ireland’s Grow Digital portal provides a useful example of good practice, consolidating support programmes, training and funding information, and a self‑assessment tool to help firms identify their digital needs.

Figure 2. Romania’s R&D spending is very low

Gross domestic expenditure on R&D, 2024 or latest available
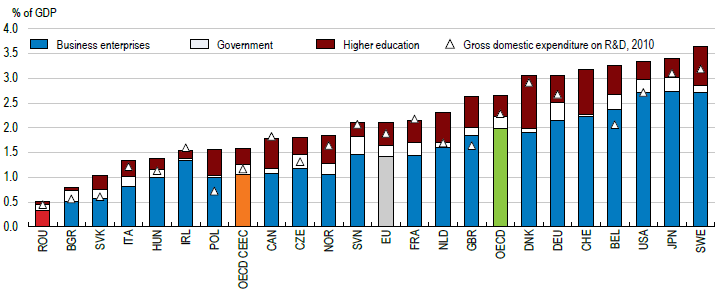
Note: OECD CEEC is the non-weighted average of Czechia, Hungary, Poland, Slovak Republic, and Slovenia.
Source: OECD Main Science and Technology Indicators database.

The economy’s productive capacity depends critically on the availability of advanced skills. As Romania moves up the value chain, demand for technical, digital, and managerial competencies is set to rise. Yet the country starts from a challenging position, with a high share of adults with low educational attainment, persistently elevated early‑school‑leaving rates, and comparatively weak learning outcomes. Addressing these gaps requires broad‑based reforms, as recognised in the 2023 education reform. Romania should focus resources on key priorities and ensure effective delivery – modernising curricula, strengthening teacher capacity, and investing in school infrastructure, particularly in disadvantaged areas. These efforts must be supported by sustainable and adequate financing, alongside a stronger focus on lifelong learning and continuous skills upgrading.

Fostering a dynamic, growth‑oriented business environment requires a regulatory framework that supports entrepreneurship, competition, and firm expansion. While Romania has made progress in improving the regulatory environment and market efficiency, further steps are needed. Starting and operating a business remains more burdensome than in top‑performing OECD countries, despite ongoing simplification efforts. Priority should be given to accelerating the implementation of the streamlined single industrial licensing procedure and strengthening the insolvency framework – including by improving the efficiency of court procedures and expanding the use of digital tools in insolvency cases. Further improvements in the efficiency and accessibility of public procurement processes are also required

Finally, the Survey highlights opportunities to further strengthen transport infrastructure, including by improving network connections, ensuring more efficient transport pricing, and enhancing road maintenance. Promoting alternative low‑emission transport modes and improving governance in the transport sector will also be essential to support sustainable mobility and improve overall system performance.

Visit the OECD’s Romania Economic Snapshot page for further information.

References:

OECD (2026), OECD Economic Surveys: Romania 2026, https://doi.org/10.1787/4844067e-en, OECD Publishing, Paris.



The investor base for sovereign debt: Recent developments and potential implications

Long-term sovereign bond yields have risen as fiscal pressures mount and central banks step back from bond markets. With private investors playing a larger role, borrowing costs may remain higher and markets may become more volatile, raising important questions for debt management and financial stability.

By Masatoshi Ando, Ben Conigrave, Álvaro Pina and Caroline Roulet, OECD Economics Department.


Long-term sovereign bond yields have risen in recent years and the spread between 30- and 10-year bond yields has widened (Figure 1, Panel A). This reflects investor concerns about the sustainability of public debt given persisting budget imbalances in many advanced economies and rising spending pressures from defence, ageing and climate change. At the same time, as discussed in the December 2025 OECD Economic Outlook, there have been marked changes in the mix of investors purchasing government bonds since the pandemic. These changes in the investor base likely contribute to the upward pressure on yields and may also be a source of future market volatility.

One key factor has been the shift from quantitative easing to quantitative tightening by the major central banks. The balance sheets of central banks expanded after the onset of the global financial crisis, and were boosted significantly further during the pandemic, primarily through sovereign debt purchases. More recently, with the shift to quantitative tightening in many jurisdictions, central banks have reduced their sovereign bond holdings either passively, by not reinvesting maturing securities, or by actively selling bonds. The share of total outstanding domestic sovereign debt held by the central bank is now largely back to pre-pandemic levels, including in the United States and the euro area (Figure 1, Panel B).

Figure 1. Long-term yields have risen and central bank bond holdings have shrunk

Note: Panel A shows weekly data, with the latest observation dated 20 February 2026. In panel B, ECB denotes the European Central Bank, US Fed the US Federal Reserve, BOC the Bank of Canada, and RBA the Reserve Bank of Australia. Domestic sovereign bonds held by central banks at the end of each year are expressed as a share of total domestic sovereign bonds outstanding. Data for 2025 data refer to Q3.
Source: Australian Bureau of Statistics; Bank of Canada; European Central Bank; Federal Reserve; Reserve Bank of Australia; Statistics Canada; LSEG; and OECD calculations.

A counterpart to this is that the private sector has absorbed a rising share of new bond issuance, with the composition of investors becoming more dispersed and heterogenous (Figure 2). Over the year to 2025Q3 there were higher net purchases relative to GDP by banks and money market funds in all four economies displayed, and by other financial intermediaries such as investment funds and securities dealers in Australia, the euro area and the United States. In contrast, net purchases of sovereign bonds by traditional institutional investors, including pension funds and insurers, often declined relative to GDP.

The shift in the balance of sovereign bond purchases from central banks to price-sensitive private sector investors could affect the required rate of return on sovereign bonds (OECD, 2025; IMF, 2025). Yields might be more elevated to sustain demand for government debt in coming years, particularly in countries where fiscal trajectories may be viewed as unsustainable, pushing up the cost of government borrowing.

A related risk is that sovereign bond markets become more volatile. Some non-bank financial institutions have comparatively light regulatory frameworks, allowing them to operate with higher leverage. An example is hedge funds, which have been playing a growing role in the sovereign debt markets of many countries, including the US. High leverage could reduce their capacity to absorb new bond issuance at times of market stress due to a need for higher liquidity to meet potential investor redemptions and to offset changes in the value of their existing collateral (ECB, 2023; Sengupta and Jacobs, 2025). Higher bond market volatility may itself raise liquidity needs due to margin calls or redemptions from leveraged investment funds, potentially forcing asset sales including sovereign bonds.

Reforms affecting pension funds and associated financial intermediaries, coupled with a more uncertain environment, will also reduce the demand for very long-term bonds. For example, UK regulatory adjustments for liability-driven investment (LDI) funds introduced after the 2022 gilt market dislocation (LDI funds allow pension funds to match the interest sensitivity of their assets and liabilities through the use of derivatives) — including tighter leverage limits, higher liquidity buffers, and more conservative collateral management practices — reduced their capacity to maintain large, leveraged positions in long-dated gilts (BIS, 2025). In Japan, higher yields and elevated policy uncertainty have made life insurers moderate their demand for very long‑term sovereign bonds, at least temporarily (Reuters, 2025). The shift from defined benefit to defined contribution schemes in countries such as the Netherlands and the United Kingdom has also reduced the emphasis on duration matching of fixed liabilities for pension funds, diminishing their demand for long-term sovereign bonds (PIMCO, 2023).

For a given maturity distribution of debt issuance, such reforms potentially raise yields and volatility at the long end of the yield curve, though the increasing demand for safer assets such as government bonds from funded pension systems as the population ages will have the opposite impact. Some debt management offices have also shifted issuance toward shorter maturities to mitigate rising interest expenditures, although this may heighten refinancing risks and governments’ sensitivity to fluctuations in short‑term interest rates.

Figure 2. Net purchases of sovereign bonds by investor type in selected advanced economies

Quarterly averages

Note: The figure shows net purchases of general government debt securities of all maturities, consolidated to eliminate intra-government transactions. Quarterly averages are presented for three periods: the latest quantitative easing (QE) episode, the subsequent period of quantitative tightening (QT), and the most recent four quarters with available data for all four jurisdictions (which often overlaps the QT period). QE and QT periods follow central bank announced implementation dates. When both QE and QT take place in the same quarter, none is retained unless one clearly outweighs the other. “Other financial intermediaries” include non-money market investment funds (among which hedge funds), securities dealers and non-bank money lenders. “Institutional investors” refers to insurance companies and pension funds. “Real sectors” encompass households, non-profit organisations, and non-financial corporations. Data are seasonally adjusted and expressed as a share of contemporaneous quarterly GDP. For the United States, net purchases by households are likely overstated, and those by foreign hedge funds (included in the rest of the world) concomitantly understated, since 2023 (Barth et al., 2025).
Source: Australian Bureau of Statistics; European Central Bank; Federal Reserve; Statistics Canada; OECD National Accounts Databases; and OECD calculations.

References

BIS (2025), BIS Quarterly Review, September, Bank for International Settlements.

Barth, D., Beltran, D., Hoops, M., Kahn, J., Liu, E., and M. Perozek (2025), The Cross-Border Trail of the Treasury Basis Trade, Federal Reserve Board of Governors, FEDS Notes, October.

ECB (2023), Financial Stability Review, November 2023.

IMF (2025), “Shifting ground beneath the calm: Stability challenges amid changes in financial markets”, Global Financial Stability Report, October, International Monetary Fund, Washington D.C.

OECD (2025), Global Debt Report 2025: Financing Growth in a Challenging Debt Market Environment, OECD Publishing, Paris.

Pimco (2023), The End of the Dutch Defined Benefit Model A Steeper Euro Swap Curve Ahead, July.

Reuters (2025), Japan’s major life insurers plan to trim yen bond holdings in Oct-March, October.

Sengupta, R. and J. Jacobs (2025), The Changing Investor Composition of U.S. Treasuries, Part 2: Who’s Buying U.S. Treasuries?, Economic Bulletin, Federal Reserve of Kansas City, July.


Raising Thailand’s productivity through regulatory reform

Thailand has made considerable economic advances over recent decades, but progress has slowed over the past several years, notably in productivity growth.

By Philip Hemmings, Jens Arnold, Charles Dennery and Isabella Medina, OECD Economics Department


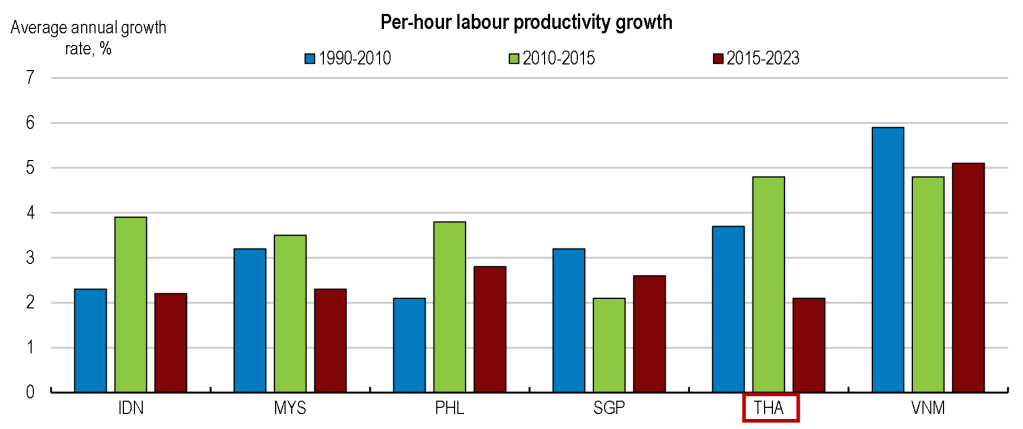
Sustained gains in labour productivity are essential for lifting output per capita and improving living standards. Yet Thailand has seen a marked slowdown in recent years. From 2015 to 2023, labour productivity grew by only 2.1% on average, a sharp decline from 3.7% between 1990 and 2010 and 4.8% between 2010 and 2015. Many countries have faced weaker labour productivity growth, but Thailand’s drop has been especially pronounced (Figure 1). Total factor productivity has also stagnated over 2015–2023, which points to missed opportunities to adopt new technologies and strengthen innovation—both crucial for boosting long‑term economic performance.

Figure 1. Productivity growth has slowed

Note: Per-hour labour productivity is calculated by dividing total output by total hours worked.
Source: APO Productivity Database 2025.

One way for governments to lift productivity is by updating rules and regulations to promote stronger competition. When firms face real competitive pressure, they are driven to innovate, improve efficiency, and deliver better outcomes.

However, OECD product market regulation (PMR) indicators (Box 1) show that Thailand’s regulatory environment remains one of the least supportive of competition (Figure 2). The data place Thailand among the most restrictive economies, with an aggregate PMR score of 2.4 — the 4th highest out of 47 countries assessed.

Like many emerging market economies, Thailand’s score is well above those of most OECD members, where the average stands at 1.3. This gap highlights significant room for Thailand to streamline regulations, open markets, and create a more dynamic environment for businesses to grow and innovate.

Figure 2. Thailand has considerable scope to make regulation more competition-friendly

Note: Thailand is shaded in red, while other non-OECD member countries are shaded in grey.
A higher score on the OECD Product Market Regulation (PMR) indicator indicates more restrictive regulatory settings as regards market competition. The maximum possible score is 6.
Source: OECD-ADB 2023-2024 Product Market Regulation database.

The latest OECD Economic Survey of Thailand highlights several policy areas through which strong, targeted regulatory reform could help unlock the country’s productivity potential. One of these is regulation that impedes foreign investment and trade. While Thailand offers incentives such as tax breaks and special visas for high‑skilled foreign workers, some rules still reduce its appeal. In particular, foreign ownership limits in some sectors and relatively high import–export processing fees continue to discourage investment and trade.

Another area with scope for improvement relates to market competition. Oversight of State‑owned Enterprises could be improved, especially regarding anti‑competitive conduct. Thailand’s competition law would also benefit from technical enhancements, including greater public disclosure about investigations into anti‑competitive behaviour.

Thailand could also step up its efforts to continue reducing red tape. Ongoing work to streamline administrative procedures—such as those for starting a business — is welcome, but the PMR indicators suggest that more can be done. Keeping regulatory simplification high on the agenda will help reduce costs, delays, and barriers for firms.

Finally, further progress in anti‑corruption measures could improve business perceptions about economic governance. Thailand still ranks poorly in Transparency International’s Corruption Perceptions Index, standing 116th out of 182 countries in 2025. Stronger action should include full alignment with the OECD Anti‑Bribery Convention and systems that promote transparent, responsible interactions between parliamentarians and lobbyists.

The systematic benchmarking that the OECD PMR indicators allow across a range of policy areas point to specific areas where reforms could foster stronger alignment with international best practice. Such reforms would help Thailand make progress towards its strong ambitions for the future, including becoming a high-income country by 2037.

For more information, please visit the Thailand Economic Snapshot page.

References:

OECD (2025), OECD Economic Surveys: Thailand 2025, OECD Publishing, Paris, https://doi.org/10.1787/426b9bc0-en.


Why Argentina needs a labour market reform

Argentina is going through one of the most comprehensive reform efforts in its history. Since late 2023, the authorities have taken unprecedented measures to reform fiscal, monetary, trade and regulatory policies, all of which have triggered significant improvements in the business environment. For this transformation to translate into new jobs and better living standards, policymakers need to continue reducing institutional and market frictions that impose costs on the reallocation of workers from low- to high-productivity sectors.


By Priscilla Fialho, OECD Economics Department

Argentina’s recent reform efforts are bearing fruits, and key macroeconomic indicators have improved significantly. Growth has likely exceeded 5% in 2025 and is projected to remain above 4% in 2026. Annual inflation fell from more than 200% in late 2023 to slightly above 30% in December 2025, and the government achieved a balanced budget for two consecutive years. Despite tighter fiscal policy and domestic financial conditions, labour markets have remained resilient and the poverty rate fell from a peak of 53% in early 2024 to about 32% in the first half of 2025. Following the introduction of a more flexible exchange rate framework in January 2025, foreign reserve accumulation has finally resumed. Markets have responded positively, and the country risk declined to levels consistent with a potential return to international capital markets.

The ambitious reform programme quickly led to improvements in sectors where Argentina has vast comparative advantages. Investments accelerated in the oil and gas and the mining sectors, both of which will help reduce external vulnerabilities in a durable manner. Lower export taxes are encouraging an expansion of agricultural production. More competitive manufacturing sectors are expected to expand at the expense of more traditional ones, thanks to lower prices for imported inputs and capital goods. At the same time, less stringent foreign exchange regulations and the expansion of private credit are supporting financial intermediation and knowledge-based sectors.

But expanding activity has not always come with sizeable increases in formal employment. Out of 19 sectors, only 6 officially increased their staffing levels in the last two years. Where employment has increased, this was mostly driven by informal jobs, which already account for about half of employment. Widespread informality can limit growth opportunities in the future, as informality often keeps resources trapped in low-productivity activities, discourages on-the-job training and undermines the public sector’s capacity to deliver high-quality public services. More visible improvements in labour market and social outcomes would also bolster public support for further reforms. In a nutshell, one challenge ahead is to ensure that growth translates into higher-quality employment.

Labour market regulations have been historically rigid

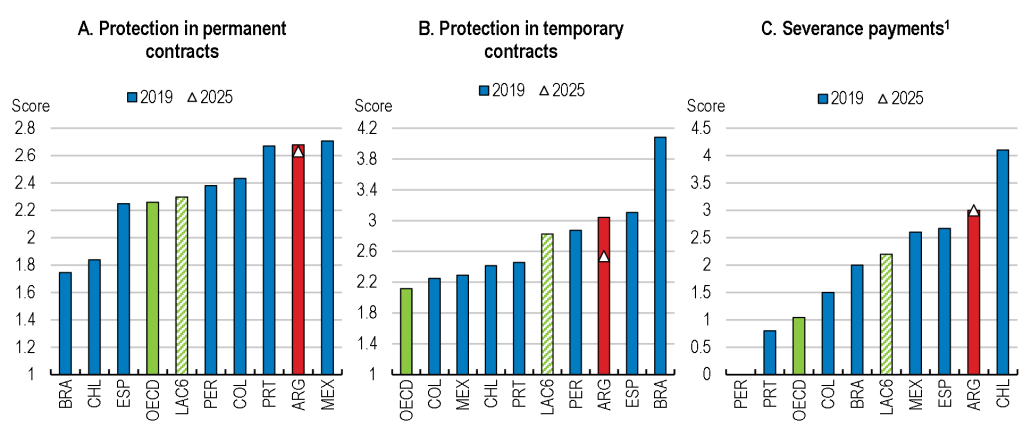
Despite recent improvements, Argentina still has stricter labour market regulations than other countries, based on the OECD Employment Protection Indicators that compare the stringency of hiring and dismissal rules across countries (Figure 1).

Figure 1. Argentina has stricter labour market regulations than peers

Note: The OECD indicators of employment protection are synthetic indicators of the strictness of regulation on dismissals and the use of temporary contracts, expressed on a scale from 0 (least restrictive) to 6 (most restrictive). For each year, indicators refer to regulation in force on the 1st of January. LAC6 includes Argentina, Brazil, Chile, Colombia, Mexico and Peru.
Source: OECD Strictness of employment protection.

In Argentina, employers can only dismiss workers in cases explicitly defined by law. This holds both for individual dismissals – where employers wish to separate from individual employees- and to collective dismissals – where firms wish to downsize there workforce. The definition for collective dismissals is exceptionally restrictive in Argentina and the administrative procedure particularly onerous. In addition, court cases can take a long time – on average, between two to four years – and can be filed up until two years after a dismissal, exposing firms to elevated uncertainty and contingent litigation risk. Severance payments, the compensation that firms have to pay in case of dismissal, are also high in international comparison, significantly exceeding those in regional peers. These payments amount to one month of salary for every year of service in most cases, without any cap.

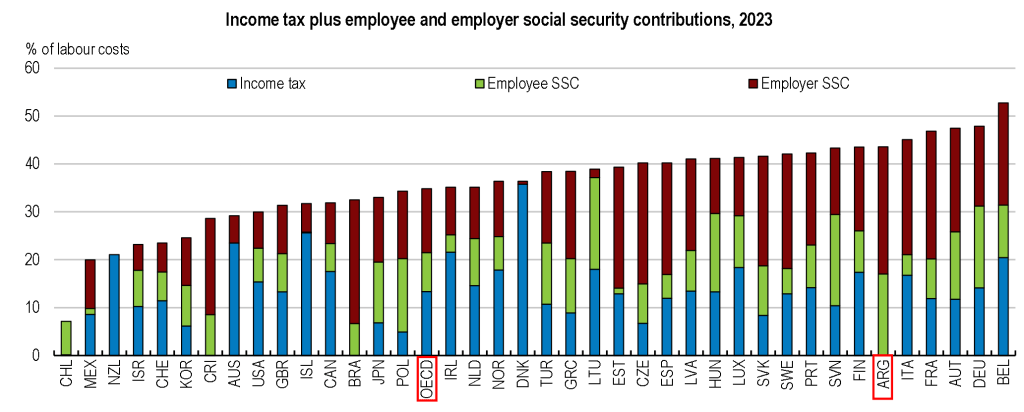
In addition, Argentina has the highest average labour tax wedge in Latin America, above most OECD countries (Figure 2). The labour tax wedge is the difference between what it costs a firm to employ someone and the worker’s take-home pay, which in the case of Argentina can be almost fully attributed to social security contributions. High social contributions discourage demand for and supply of formal labour.

Finally, the collective bargaining system is another source of labour market rigidities. Collective bargaining is organised at the sectoral level, where the labour unions and employer organisations with the highest number of members have the monopoly to bargain on behalf of all firms and employees in the sector. Agreements made between the signatory parties are then automatically extended to the entire sector. Firm-level agreements are strictly regulated by higher-level agreements and cannot apply less favourable terms for employees. Agreements remain valid until a new negotiation takes place, and outdated agreements often last over long periods of time, making it difficult for firms to adapt to changing environments.

Figure 2. The labour tax wedge increases the unit cost of labour

Note: Brazil (2019). Single individual without children at the income level of the average worker. It includes payroll taxes where applicable. Data for Argentina refers to 2013/2016.
Source: OECD Taxing Wages in Latin America and the Caribbean 2016, OECD Taxing Wages 2024 – Country details, IBGE, OECD Taxing Wages in Selected Partner Economies: Brazil, China, India, Indonesia and South Africa in 2019.

Strict labour market regulations hurt particularly the most vulnerable

An extensive international academic literature suggests that rigid labour market institutions and limited opportunities for job mobility are associated with lower investment, formal employment, productivity and output. First-time jobseekers without relevant experience, older workers who struggle to keep up with new technologies, or less-educated workers, may be particularly affected. Smaller and younger firms may also be at a disadvantage, struggling to compete with large firms that often find it easier to bear the resulting compliance costs.

The last OECD Economic Survey of Argentina provides several policy recommendations to enhance the flexibility of labour market regulations and increase incentives for formal employment. The Survey recommends reducing the amount of severance payment mandated by law. In Chile, for example, severance payments are limited to 330 days of service. The report also encourages the wider application of schemes that provide a voluntary alternative to standard severance payment rules, such as individual worker accounts that can be accessed for income support at the termination of employment, and whose remaining balances can be carried over to new jobs. Moreover, the Survey provides examples of OECD countries that introduced temporary opt-out clauses, allowing the suspension or the firm-level renegotiation of sectoral agreements in cases of economic difficulties. Finally, the Survey discusses options to reduce the labour tax wedge, in particular social contributions, without jeopardising Argentina’s fiscal consolidation efforts. One option would be to unify the current array of available social benefits into a universal multi-pillar system that includes informal workers and provides better incentives for formal job creation. A recent OECD report expands on that discussion, quantifying the estimated fiscal cost of such reforms.

The time for reform is now

Argentina’s Congress is currently debating a labour market reform proposal. The proposal seeks to address some of Argentina’s main challenges:

  • More flexible employment protection. The bill aims to reduce uncertainty and contingent litigation risk upon dismissal by clarifying that severance pay is the only compensation that can be claimed upon the termination of an employment contract, thus excluding the possibility of additional civil appeals and indemnities.  In addition, it seeks to introduce a voluntary Labour Assistance Fund to cover severance payments from monthly employer contributions of 3% of workers’ remuneration.
  • Lower labour tax wedge. Employers adhering to the above-mentioned fund will have a 3% reduction in pension contributions.
  • Modernise collective wage negotiations. The draft bill proposes that firm-level agreements can prevail over agreements of a broader scope, whether prior or subsequent. It also intends to limit the automatic extension of clauses once an agreement expires.

Research shows that the timing of labour market reforms matters. Labour market reforms that facilitate the reallocation of workers are much more likely to have positive short-term and long-term effects on employment during economic expansions, and Argentina’s economy is currently growing strong. The timing for a labour market reform could hardly be better.

References

OECD (2025), OECD Economic Surveys: Argentina 2025, OECD Publishing, Paris, https://doi.org/10.1787/27dd6e27-en.


Confronting Climate Change in the Philippines:  Building Resilience while Cutting Emissions

Flooding in 2025 in Balagtas Bulacan, Philippines
Climate change is not a distant threat for the Philippines. Preparing for a warmer and more volatile future will require building on past progress in investing into climate change adaptation, combined with carbon pricing and cleaner power generation.


By Patrick Lenain, Senior Associate, Council on Economic Policies

Climate change is not a distant threat for the Philippines. Mean land temperatures have already increased by roughly 1.4°C compared with the mid-20th century, typhoons are intensifying, sea levels are rising, and the frequency of heatwaves and heavy rainfall are increasing. Long-term modelling suggests that GDP losses could reach 4% by 2040 and 17% by 2070. (Figure 1).  

Preparing for a warmer and more volatile future 

Recognising that further increases in temperatures are inevitable, the government has adopted a National Adaptation Plan for 2023–2050 covering eight priority sectors, including agriculture, water, health, ecosystems and infrastructure. The plan emphasises stronger infrastructure, social protection, empowered local governments and nature-based solutions to reduce vulnerability and integrate adaptation into development planning.  

Over the longer term, adaptation financing needs could reach roughly USD 100 billion between 2025 and 2040. Yet, the economic case for early action is strong. Investments in resilient infrastructure and improved agricultural techniques could significantly reduce projected output losses if  executed efficiently. This will require strengthened governance for procurement, including high levels of transparency and accountability. 

Agriculture illustrates the urgency of adaptation. Rising temperatures have already reduced rice yields. Saltwater intrusion, drought and pest outbreaks are compounding risks. Policy responses include drought-tolerant crops and climate-smart farming practices, but scaling these measures will require stronger research capacity and sustained investment.   

Focusing on nature-based solutions will offer large benefits. Mangroves, forests and coral reefs provide coastal protection, support fisheries and sustain tourism while acting as carbon sinks. Market-based payments for ecosystem services and participation in carbon markets could help finance conservation and strengthen community resilience.   

Adaptation also demands macro-financial readiness. Climate shocks can push non-performing loans higher and erode banks’ capital buffers, underscoring the need for stress testing and supervisory tools that integrate physical and transition risks.  Without such safeguards, climate events could give rise to financial stability risks.

Bending the emissions curve 

Although the Philippines remains a relatively low emitter due to its service-oriented economy, emissions are rising quickly (Figure 2). If this trajectory continues, the country risks locking in a more carbon-intensive growth path than necessary. The government has pledged to reduce greenhouse-gas emissions and is preparing its new Nationally Determined Contribution for 2025-30 with this objective. 

The electricity sector sits at the centre of decarbonisation challenges. The government aims to raise the renewable share of electricity from 21% today to 35% by 2030 and 50% by 2040.  At present, however, coal remains the main source of electricity generation (Figure 3). A moratorium on new coal plants has signalled progress, but exemptions introduced in 2025 risk undermining the policy. Early retirement of coal facilities could avoid hundreds of millions of tonnes of CO₂, with large environmental benefits.   

Carbon pricing remains too modest to provide strong incentives for shifting to renewable energy sources. Coal excise duties correspond to roughly EUR 1 per tonne of CO₂ — far below estimates of the social cost of carbon. Aligning energy excise taxes with carbon contents and moving forward with an emissions trading system would sharpen price signals and steer capital toward low-carbon technologies. 

Renewable energy auctions, fiscal incentives, streamlined permitting and full foreign ownership to attract investment have had more success in supporting the shift to renewable energy sources. A flagship project is Terra Solar, expected to be the world’s largest integrated solar and battery facility, with 5 million solar panels, 3.5 GW of photovoltaic capacity and 4.5 GWh of storage. To accommodate intermittent generation, new solar projects are required to include at least four hours of storage and the government is upgrading the grid under the Smart Grid and Green Plan.  

A positive adaptation-mitigation nexus 

While adaptation and mitigation are often treated as separate agendas, they are very much interconnected. Climate resilience supports growth, protects fiscal sustainability and shields the financial system, while decarbonisation reduces long-term physical risks and strengthens energy security. Mangrove restoration is a textbook example: it can protect coastlines from storm surges while also storing large amounts of carbon. 

The overall policy direction taken by the Philippines is welcome: integrate climate risk into macroeconomic policy, mobilise private capital, expand nature-based solutions and accelerate the energy transition. What matters for the years to come is to continue this course, with an even stronger focus on well-executed and transparent public adaptation investment, sufficient carbon pricing and a continued move away from coal-fired power generation.

References:

OECD (2026), OECD Economic Surveys: Philippines 2026, OECD Publishing, Paris, https://doi.org/10.1787/f0e0c581-en.


Philippines: Towards a new productivity push – Building on past progress to improve living standards

Manila, Philippines - January 2020 -
The Philippines has strong economic fundamentals, but the population boost that has supported growth is fading, making reforms to competition, public finances and formal jobs increasingly important to keep incomes rising.


By Jens Arnold and Cyrille Schwellnus, OECD Economics Department

Over the past decade and a half, the Philippines has been among the fastest-growing emerging market economies. Output has more than doubled since 2010, and poverty has fallen sharply. Policy reforms, including the introduction of universal health insurance and greater openness in key sectors, have helped translate growth into rising living standards. 

The next phase will be more challenging. Population growth is slowing, global trade growth is weaker, and climate risks are rising. To meet its ambition of tripling income per capita relative to 2015 by 2040, the Philippines will need to raise productivity growth well above its recent pace. The recent OECD Economic Survey of the Philippines sets out how this can be achieved. 

Future spending needs call for rebuilding fiscal buffers

Economic growth slowed in the second half of 2025 after a strong start to the year. Private consumption remains resilient, supported by a tight labour market and easing inflation. Investment, however, has weakened, reflecting high borrowing costs and a temporary slowdown in public construction.

Public debt remains well above pre-pandemic levels (Figure 1). Fiscal policy should now rebuild buffers to prepare for future spending needs. Stepping up fiscal consolidation in 2026, and especially mobilising additional public revenues, would help put debt on a more prudent path while ensuring space for public infrastructure investment and future social spending.

Figure 1: Public debt has increased
Note: General government debt. OECD is the weighted average of all OECD countries.
Source: IMF and OECD Economic Outlook database.

Mobilising higher revenues could include phasing out VAT exemptions, most of which fail to help those with lower incomes, such as blanket exemptions for private healthcare, education or for all senior citizens. The removal of these exemptions could be combined with social transfers targeted to vulnerable households, which would shield them from bearing the costs of the reform. Shifting corporate tax incentives away from tax holidays toward expenditure-based incentives would reduce windfall gains and create stronger incentives for productivity-enhancing investment.

Raising productivity growth to reach ambitious income targets 

Slower population growth means future income gains will depend much more on productivity than on an expanding labour force. To reach the 2040 income per capita target, average productivity growth will need to rise to more than 5% annually, well above the rate of about 3% achieved over the past 15 years (Figure 2).

Stronger competition is central to this effort. Electricity prices remain high, reflecting persistent vertical integration between generation, distribution and retail supply. Requiring distribution utilities to divest generation assets and exit retail activities would strengthen competition and lead to lower electricity costs for firms and households.

Telecommunications services are similarly costly by regional standards. Mandating open and non-discriminatory access to network infrastructure at regulated tariffs, overseen by an operationally independent regulator, would encourage entry and improve service quality.

Foreign investment restrictions have eased, but administrative burdens remain heavy. Lengthy approval processes, overlapping mandates and decentralised permitting create uncertainty and deter investment. Establishing a single-window approval system with strict deadlines and digital tracking would significantly improve the business environment.

Persistently high perceptions of corruption further undermine investor confidence. Stronger prevention, well-resourced investigations and consistent prosecution are needed to reinforce accountability across all levels of government.

Expanding social protection while strengthening incentives for formal job creation

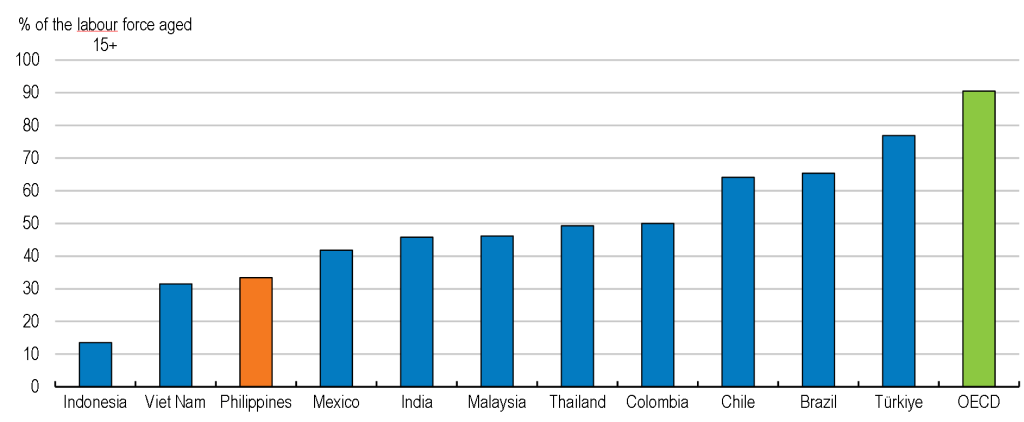
Around two thirds of workers are employed in informal jobs, which do not provide for full social and labour protections (Figure 3). High social contributions, binding minimum wages in low-productivity regions, and strict dismissal rules discourage formal hiring, particularly for low-wage workers.

Figure 3: The share of active contributors to a pension scheme is low

Note: 2023 or latest available year.
Source: ILO World Social Protection Data Dashboards.

Moving to a two-tier social protection system would help address this challenge. A basic tier, financed from general tax revenues, could provide universal coverage with essential benefits, including non-contributory pensions and universal health insurance. A second, more generous tier, could be financed through social contributions and top up basic benefits for those with higher earnings. This approach would broaden coverage while reducing the cost of formal employment, especially for low-wage workers.

Labour market regulations also weigh on formality. In regions with low productivity, minimum wages remain high relative to earnings, and informal hiring can be one way around these rules. At the same time, complex dismissal rules and legal uncertainty raise hiring risks. Moderating minimum wage increases where wages are not well aligned with productivity and increasing predictability in employment protection, including by capping compensation payments, would further support formal job creation.

The time to act is now

The Philippines has strong fundamentals, but the demographic tailwinds that have supported growth in the past are now fading. A comprehensive reform package that strengthens competition, restores fiscal space and promotes formal employment would be an effective way to sustain rapid income growth over the coming years.

For more information, visit the Philippines economic snapshot page.

References:

OECD (2026), OECD Economic Surveys: Philippines 2026, OECD Publishing, Paris, https://doi.org/10.1787/f0e0c581-en.


Unlocking Peru’s untapped talent by turning education into social mobility

Peru’s young population is full of potential, but too much of it remains underused. Intergenerational mobility has improved in education but remains weak in incomes. This disconnect explains why a young and increasingly educated population has not translated into stronger productivity growth or broader economic opportunity.


By Paula Garda, OECD Economic Department
Read the spanish version

Despite rising educational attainment across generations, weak learning outcomes and school-to-work transitions, widespread informality, and persistent gender gaps limit upward mobility and prevent human capital from being fully used. Addressing these constraints would lift productivity, expand formal employment, and raise Peru’s long-term growth potential. Peru’s young population is full of potential, but too much of it remains underused. Intergenerational mobility has improved in education but remains weak in incomes. This disconnect explains why a young and increasingly educated population has not translated into stronger productivity growth or broader economic opportunity. Despite rising educational attainment across generations, weak learning outcomes and school-to-work transitions, widespread informality, and persistent gender gaps limit upward mobility and prevent human capital from being fully used. Addressing these constraints would lift productivity, expand formal employment, and raise Peru’s long-term growth potential.

Access to education has improved, but outcomes remain weak

Educational attainment has improved substantially across generations. Intergenerational educational mobility, that measures whether children reach higher levels of education than their parents, has increased by 56% between cohorts born in the 1940s and those born in the 1980s (Figure 1). This improvement is larger than in most Latin American peers and reflects sustained expansion of access to school over several decades.

But progress has been uneven. Only 59% of 15–19-year-olds are enrolled in school reflecting high dropout rates, especially in rural areas, where long commutes, financial pressures, and early entry into the labour market pull students out of school.

Progress in education has not translated into similar income mobility. Intergenerational income mobility, that measures whether children earn more than their parents as adults, has risen by only 15%, far less than education mobility, showing that higher education has not led to proportional income gains across generations. Where a child grows up and whether their parents work informally continue to strongly shape earnings prospects in adulthood. Rural residents, women, and children of informal workers remain significantly less likely to surpass their parents’ income, constraining both equity and aggregate growth.

When schooling does not lead to better earnings

Learning outcomes remain weak despite higher enrolment. Peru’s PISA scores are well below the OECD average, placing the country close to the bottom among participating economies. Students from poorer households perform substantially worse than their peers, reflecting gaps in teacher quality, infrastructure, and access to basic services, particularly in rural schools.

Weak learning outcomes contribute to difficult school-to-work transitions. Around one in five young Peruvians is not in employment, education, or training. NEET rates are higher among women, driven in part by early motherhood and limited access to childcare, which restricts labour market attachment at the start of working life.

Even those who do work are often trapped in informal jobs. Over 71% of all workers, and over 85% of young workers, are informal (Figure 2). Informal jobs offer limited training, low wages, and no social protection, reducing incentives for skill accumulation. As a result, informality is frequently transmitted across generations, locking families into low-productivity employment and weakening aggregate productivity growth.

Gender disparities reinforce these dynamics. Women have largely closed education gaps relative to men but still face a 17 percentage point employment gap and earn 19% less on average. Unequal care responsibilities and limited childcare and eldercare services push many women into informal or part-time jobs, lowering lifetime earnings and reducing labour supply.

Policy priorities to boost intergenerational mobility

Unlocking Peru’s full potential requires action on several fronts:

  • Improve education quality and early foundations. Expanding access for children under three, especially in rural and vulnerable areas, would improve cognitive outcomes and support higher female labour force participation. Strengthening teacher training, enforcing merit-based recruitment, and upgrading rural school infrastructure are essential to close learning gaps and reduce dropout rates.
  • Strengthen school-to-formal-work transition. Vocational education and training remains underdeveloped. Only 2% of youth are enrolled in VET programmes, far below OECD benchmarks. Expanding VET, improving governance, and aligning curricula with labour market needs would ease entry into formal employment. Second-chance education combined with employment services and targeted social support can help re-engage NEET youth.
  • Create formal jobs. Improving skills as outlined above would help reduce informality, but a comprehensive agenda combining skills, labour, and business reforms is needed to make formality the norm. Shifting social security contributions away from firm-size thresholds toward progressive labour-income-based contributions would reduce incentives to remain small or informal, especially for low-wage workers. Streamlining labour and business regulations, strengthening enforcement, and improving SME productivity and access to finance would support higher-quality job creation.

Improving intergenerational mobility is a driver of economic growth. When children can reach their full potential regardless of their family background, the country benefits from a larger, better-skilled workforce. By improving education quality, expanding formal jobs, and reducing gender disparities, Peru can turn its young population into the engine of stronger, broadly shared growth.

For more information: OECD Economic snapshot for Peru.

Reference

OECD (2025), https://www.oecd.org/en/publications/oecd-economic-surveys-peru-2025_76f6eb73-en.html, OECD Publishing, Paris.


Aprovechar el talento del Perú convirtiendo educación en movilidad social

La población joven del Perú tiene un gran potencial, pero una parte importante sigue sin aprovecharse. La movilidad intergeneracional ha mejorado en educación, pero sigue siendo débil en ingresos. Esta desconexión explica por qué una población joven y cada vez más educada no se ha traducido en un mayor crecimiento de la productividad ni en oportunidades económicas más amplias.


Por Paula Garda, Departamento de Economía de la OCDE
Leer la versión en inglés

A pesar del aumento del nivel educativo entre generaciones, los débiles resultados de aprendizaje y transiciones escuela-trabajo, la elevada informalidad y las persistentes brechas de género limitan la movilidad ascendente e impiden que el capital humano se utilice plenamente. Abordar estas limitaciones permitiría aumentar la productividad, ampliar el empleo formal y elevar el potencial de crecimiento de largo plazo del Perú.

El acceso a la educación ha mejorado, pero sus resultados siguen siendo débiles

El nivel de educación alcanzado ha mejorado sustancialmente entre generaciones. La movilidad educativa intergeneracional, que mide si los hijos alcanzan niveles educativos superiores a los de sus padres, aumentó un 56% entre las cohortes nacidas en las décadas de 1940 y 1980 (Figura 1). Este avance es mayor que en la mayoría de los países pares de América Latina y refleja una expansión sostenida del acceso a la educación durante décadas.

Sin embargo, el progreso ha sido desigual. Solo el 59% de los jóvenes de 15 a 19 años está matriculado en el sistema educativo, lo que refleja elevadas tasas de abandono escolar, especialmente en las zonas rurales, donde largos desplazamientos, presiones económicas y una entrada temprana al mercado laboral alejan a muchos estudiantes de la escuela.

Los avances educativos no se han traducido en una movilidad de ingresos similar. La movilidad intergeneracional de ingresos, que mide si los hijos ganan más que sus padres en la adultez, aumentó solo un 15%, muy por debajo de la movilidad educativa. Esto muestra que una mayor educación no ha generado aumentos proporcionales de ingresos entre generaciones. El lugar donde crece un niño y si sus padres trabajan en la informalidad siguen influyendo fuertemente en sus perspectivas de ingresos en la adultez. Los residentes rurales, las mujeres y los hijos de trabajadores informales tienen una probabilidad significativamente menor de superar los ingresos de sus padres, lo que limita tanto la equidad como el crecimiento de largo plazo.

Cuando la escuela no conduce a mejores ingresos

Los resultados de aprendizaje siguen siendo débiles pese al mayor acceso a educación. Las puntuaciones del Perú en PISA están muy por debajo del promedio de la OCDE, situando al país cerca de la parte inferior entre las economías participantes. Los estudiantes de hogares más pobres obtienen resultados considerablemente peores que sus pares, lo que refleja brechas en la calidad docente, la infraestructura y el acceso a servicios básicos, especialmente en las escuelas rurales.

Los bajos niveles de aprendizaje contribuyen a transiciones difíciles de la escuela al trabajo. Alrededor de uno de cada cinco jóvenes peruanos no estudia ni trabaja ni recibe formación. Las tasas de jóvenes que no estudian ni trabajan son más altas entre las mujeres, debido en parte a la maternidad temprana y al acceso limitado a servicios de cuidado infantil, lo que restringe la inserción laboral al inicio de la vida activa.

Incluso quienes trabajan suelen quedar atrapados en empleos informales. Más del 71% del total de los trabajadores y más del 85% de los jóvenes ocupados son informales (Figura 2). Los empleos informales ofrecen poca capacitación, bajos salarios y ausencia de protección social, lo que reduce los incentivos para acumular habilidades. Como resultado, la informalidad se transmite con frecuencia entre generaciones, atrapando a las familias en empleos de baja productividad y debilitando el crecimiento de la productividad.

Las brechas de género refuerzan estas dinámicas. Las mujeres han cerrado en gran medida las brechas educativas con respecto a los hombres, pero aún enfrentan una brecha de empleo de 17 puntos porcentuales y ganan en promedio un 19% menos. Las responsabilidades desiguales de cuidado y la limitada disponibilidad de servicios de cuidado infantil y de personas mayores empujan a muchas mujeres hacia empleos informales o a tiempo parcial, reduciendo los ingresos a lo largo de la vida y la oferta laboral.

Prioridades de política para impulsar la movilidad intergeneracional

Desbloquear todo el potencial del Perú requiere actuar en varios frentes:

  • Mejorar la calidad de la educación y las bases tempranas. Ampliar el acceso a la educación inicial para niños menores de tres años, especialmente en zonas rurales y vulnerables, mejoraría los resultados cognitivos y favorecería una mayor participación laboral femenina. Fortalecer la formación docente, aplicar criterios meritocráticos en la contratación y mejorar la infraestructura escolar rural es esencial para cerrar brechas de aprendizaje y reducir el abandono escolar.
  • Fortalecer la transición de la escuela al empleo formal. La educación y formación técnica y profesional sigue siendo limitada. Solo el 2% de los jóvenes está matriculado en programas de educación profesional y técnica (EFTP), muy por debajo de los países de la OCDE. Ampliar la EFTP, mejorar su gobernanza y alinear los programas con las necesidades del mercado laboral facilitaría el acceso al empleo formal. La educación de segunda oportunidad, combinada con servicios de empleo y apoyo social focalizado, puede ayudar a reincorporar a los jóvenes que no estudian ni trabajan.
  • Crear empleo formal. Mejorar las competencias ayudaría a reducir la informalidad, pero se necesita una agenda integral que combine reformas educativas, del mercado laboral y del entorno empresarial para que la formalidad sea la norma y no la excepción. Trasladar las contribuciones a la seguridad social desde un esquema basado en el tamaño de la empresa hacia un esquema progresivos basados en los ingresos laborales, más bajos para trabajadores de más bajos salarios, reduciría los incentivos para que las empresas permanezcan pequeñas o informales. Simplificar regulaciones laborales y empresariales, fortalecer la fiscalización y mejorar la productividad de las pymes y su acceso al financiamiento favorecería la creación de empleos de mayor calidad.

Mejorar la movilidad intergeneracional impulsaría el crecimiento económico. Cuando los niños pueden desarrollar plenamente su potencial independientemente de su origen familiar, el país se beneficiaría de una fuerza laboral más numerosa y mejor calificada. Al mejorar la calidad de la educación, ampliar el empleo formal y reducir las brechas de género, el Perú puede convertir a su población joven en el motor de un crecimiento más fuerte y ampliamente compartido.

Para más información: Panorama económico de la OCDE para el Perú.

Referencia
OCDE (2025), OECD Economic Surveys: Peru 2025, OECD Publishing, París.


Wired for power: The energy behind the AI revolution

Artificial intelligence is fast becoming a defining driver of electricity demand in Europe. As AI deployment accelerates, the key constraint is shifting from computing power to the capacity of electricity grids to absorb large, continuous and localised loads. This blog examines how updating and modernising grid planning, connection rules and energy regulation are emerging as important enablers of AI’s future in the EU.

By Ruben Maximiano and Wouter Meester, OECD Economics Department.


AI’s energy reality

Dieser Blog ist auch auf Deutsch verfügbar: Strom – die treibende Kraft der KI-Revolution

AI is often discussed as though it operates independently of physical systems. In practice, AI depends on vast amounts of electricity. Its future will be determined not only by advances in algorithms and computing power, but also by kilowatt-hours – by the ability of electricity systems to deliver power reliably and at scale.

Training and running frontier models requires continuous and increasingly large volumes of power. According to the IEA, a typical AI-focused data centre already consumes as much electricity as 100 000 households, whilst the largest new facilities could require 20 times more, placing them on par with the consumption of small countries (IEA, 2025).

As a result, an important binding constraint on AI deployment is no longer generation alone. It is increasingly the capacity of electricity systems to absorb, transport and manage large, continuous and geographically concentrated loads without conflicting with other usages. As the recent OECD Diagnostic Tool for Reducing Regulatory Barriers to Solar, Wind and Pumped Hydro Storage in the EU report shows, tackling these also involve better regulations.

The importance of energy to AI roll-out is visible in corporate energy sourcing strategies. Big Tech companies now account for the majority of Corporate Power Purchase Agreements (PPAs) in Europe (see figure 1). Yet the scale and speed of AI deployment are already outpacing what traditional PPAs can guarantee. Hyperscalers are turning to direct investment in generation, including solar, wind and nuclear, to secure long-term supply.

Taken together, these developments point to the conclusion that the next frontier of AI policy is not only about how much electricity is produced, but also about how grids are planned, reinforced and that to a significant extent depends on how grid investment and grid connection rules are regulated.

To address such barriers systematically in the EU, the OECD report Diagnostic Tool for Reducing Regulatory Barriers to Solar, Wind and Pumped Hydro Storage in the EU, identifies the regulatory bottlenecks that slow deployment of renewables in the EU and constrain grid availability, with clear parallels for policymakers seeking to adapt energy rules to enable AI deployment. As this blog is based on this work it refers mainly to EU practices and energy mix.

Global AI and local grids

While global electricity demand from AI remains moderate (expected to reach 3% globally by 2030 and 4.5% in the EU)(IEA 2025, Ember 2025), its impact is highly concentrated. Data centres cluster in locations offering robust fibre connectivity, favourable cooling conditions, low electricity prices, and fast, reliable grid access. This concentration amplifies pressure on local grids and exposes the limits of existing planning and connection frameworks.

Ireland illustrates these risks. In 2023, data centres accounted for around 21% of electricity consumption in 2023 up from 5% in 2015. Much of this has been concentrated around Dublin, where data centres consume roughly half of electricity produced. The resulting strain on the network raised security-of-supply concerns and led to the Transmission System Operator stop accepting applications for new data centres in Dublin until 2028 (Ember, 2025, CRU, 2025). In response, the national regulator is introducing a number of regulatory changes, including requirements for new data centres to install dispatchable generation or storage facilities on site.

The countries with more abundant and affordable electricity and stronger grids have a comparative advantage for the location of data centres. For instance, the Nordic countries have become attractive AI destinations due to abundant energy, strong grids and low-carbon baseload (Ember 2025). More broadly, IEA analysis suggest that jurisdictions offering significantly faster grid-connection timelines could capture up to 20% more data-centre growth by 2030 (IEA, 2025).

How AI stresses electricity systems

These pressures materialise across three interconnected timescales. In the long term, large AI campuses require transmission and distribution networks with sufficient hosting capacity, yet grid expansion and permitting often take 5 to 10 years. This makes anticipatory planning and co-ordination between data-centre siting, grid investment and local generation essential. Just as important is grid optimisation: improving system efficiency through digitalisation and AI-based system management.

In the medium term, inefficient connection rules have become a binding constraint. Long queues, speculative applications and first-come, first-served rules delay viable projects and distort planning. In real time, AI workloads introduce rapid power swings – far faster than traditional industrial loads -challenging frequency stability and voltage control.

Addressing these pressures requires regulatory frameworks that enable not only physical grid reinforcement, but also optimisation through digitalisation, flexibility procurement and stability services, and that allow system operators to invest in software and operational solutions alongside traditional capital assets.

The Diagnostic Tool shows that key elements of the regulatory system that contribute to address these pressures, would include:

  • Anticipatory grid investment supported by clear cost-recovery rules.
  • Criteria-based connection queues to prioritise ready and system-beneficial projects.
  • Hosting-capacity maps to guide efficient siting.
  • Flexible access arrangements, including non-firm and hybrid connections.
  • Tariff and market design that value flexibility and stability services.

How countries are responding

Countries are increasingly adapting electricity regulation to manage the highly localised grid impacts of AI-driven demand. Governments are experimenting across different parts of the power system. In Europe, Italy is improving locational planning through detailed hosting-capacity maps; Portugal is reallocating unused capacity and simplifying storage licensing; the UK is reforming connection queues by prioritising projects that are “first ready, first connected”; the Netherlands is deploying congestion-management zones and prioritisation criteria; and Finland is integrating data centres into heat-recovery and clean-power strategies.

Despite this diversity, common policy lessons seem to emerge. Grid access can no longer be treated as a simple administrative queue and requires prioritisation based on readiness. Locational transparency is critical to guide efficient investment. Flexibility and digital optimisation must complement traditional grid reinforcement. Finally, grid planning and permitting need to become anticipatory rather than reactive. Countries applying these principles are better positioned to accommodate AI-scale demand while preserving reliability and affordability.

Powering the age of intelligence

AI is reshaping electricity demand at a scale that is now central to economic strategy. Ensuring reliable, affordable and low-carbon supply is becoming a prerequisite for attracting and sustaining digital investment. In the age of AI, competitiveness, autonomy and resilience will increasingly be determined not only by data and algorithms, but by the rules that govern the compute infrastructure and their electricity systems.

The OECD–EU Diagnostic Tool offers governments a practical roadmap to modernise regulatory frameworks and align them with the needs of an electricity-intensive digital economy.

*We will be launching the Diagnostic Tool today, 29th January. You may register here.

References

CRU, “Large Energy Users connection policy”, December 2025, https://cruie-live-96ca64acab2247eca8a850a7e54b-5b34f62.divio-media.com/documents/CRU2025236_Large_Energy_User_connection_policy_decision_paper.pdf

Ember, 2025, Grids for data centres: ambitious grid planning can win Europe’s AI race, https://ember-energy.org/app/uploads/2025/06/Grids-for-data-centres-in-Europe.pdf

IEA, 2025, Energy and AI, World Energy Outlook Special Report

OECD, 2025, OECD–EU Diagnostic Tool for Reducing Regulatory Barriers to Solar, Wind and Pumped Hydro Storage


Why Regulating Lobbying Matters for Competition: New Insights from the OECD PMR Indicators

By Cristiana Vitale, OECD Economics Department.

Effective competition is central to vibrant economies. It keeps prices low for consumers, encourages firms to improve their products, foster an efficient use of resources, and helps innovative new firms enter markets. But market competition depends on well-designed regulation and critically, on the way policymakers interact with the stakeholders affected by those rules. A new OECD working paper highlights how stakeholder consultation is a key part of an effective regulatory framework, but inadequate transparency and accountability in interactions with interest groups risk tilting the playing field in favour of well-resourced incumbent firms.

A growing body of research shows that well-connected firms often use political influence to shape rules in ways that protect their market position by pushing for complex regulatory requirements that are disproportionately costly for smaller or newer competitors, or to obtain preferential access to contracts and loans. Political connections can help less productive firms survive while preventing more innovative ones from scaling up. The consequences are clear: markets become less contestable, innovation slows, and productivity growth suffers.

The latest update of the OECD Product Market Regulation (PMR) indicators, which track laws and regulations across 47 countries, shows that most governments require stakeholders to be consulted when new laws and regulations are drafted. This could improve policy design as stakeholder engagement helps policymakers to better understand the real-world effects of regulatory intervention. But the same data also reveal major gaps in how countries manage lobbying activities and ensure integrity standards, leaving policymaking vulnerable to undue influence (see Figure 1 below).

It is notable that more than one-half of the surveyed countries lack basic integrity safeguards for public officials involved in regulatory processes. One-third lack comprehensive conflict-of-interest rules, and over one-third do not require any cooling-off period if senior officials leave office for the private sector. Strikingly, the two countries in the survey that have none of these two integrity standards are OECD members.

Transparency in lobbying interactions is even more limited. Only two countries—Chile and Poland—meet all four key disclosure requirements assessed in the PMR data, including maintaining a public lobbyist registry and requiring policymakers to disclose both their meeting agendas and the identities of the interest groups they meet. Twelve countries have none of these obligations.

Even when lobbying registries exist, they often cover only some types of interest groups or are voluntary. Public officials’ disclosure obligations are also rare: just 28% of countries require officials to reveal which interest groups they meet, and only 23% require meeting agendas to be published online.

As governments increasingly use industrial policies to promote innovation, encourage decarbonisation, and support strategic sectors, strong safeguards against undue influence are becoming more important. Lobbying is not inherently negative; policymakers benefit from engaging with stakeholders who understand the real-world effects of regulations. However, unregulated lobbying can redirect subsidies and support toward well-connected incumbents rather than potential innovators. This undermines the effectiveness of public spending and entrenches market power instead of encouraging technological dynamism and reducing barriers to the entry and growth of new companies.

With evidence of rising market concentration across advanced economies, the risk that lobbying will impede competition is likely to grow. The new PMR data reveal a clear message: while most countries value stakeholder engagement, many do too little to ensure transparency and integrity in lobbying practices. Strengthening rules on conflicts of interest, expanding disclosures by both lobbyists and public officials, and ensuring open registers of interest groups would help restore trust and support competitive markets.

References

Vitale, C. and R. Bitetti (2026), “Regulating lobbying activities to protect competition: New evidence from the OECD PMR indicators”, OECD Economics Department Working Papers, No. 1855, OECD Publishing, Paris, https://doi.org/10.1787/ad88f58a-en.

Akcigit, U., S. Baslandze and F. Lotti (2023), “Connecting to Power: Political Connections, Innovation, and Firm Dynamics”, Econometrica, Vol. 91/2, pp. 529-564, https://doi.org/10.3982/ecta18338.

Alexander, R., S. Mazza and S. Scholz (2009), “Measuring Rates of Return for Lobbying Expenditures: An Empirical Case Study of Tax Breaks for Multinational Corporations”, SSRN Electronic Journal, https://doi.org/10.2139/ssrn.1375082.

Faccio, M. (2006), “Politically Connected Firms”, American Economic Review, Vol. 96/1, pp. 369-386, https://doi.org/10.1257/000282806776157704.

Koltay, G., S. Lorincz and T. Valletti (2023), “Concentration and Competition: Evidence From Europe and Implications For Policy”, Journal of Competition Law & Economics, Vol. 19/3, pp. 466-501, https://doi.org/10.1093/joclec/nhad012.