Higher defence spending brings forward hard fiscal policy choices and has an uncertain economic impact

By Ben Conigrave, OECD.

After falling relative to overall public expenditure and GDP in the three decades after the Cold War ended, military spending is rising again in many OECD countries. Among those that are also NATO members, a large step up in defence outlays has recently occurred in Central and Eastern European countries (Figure 1). A broader pick-up in defence spending has seen expenditures also increase in Japan, the Nordic countries and Israel.

Poland and the Baltic states (Estonia, Latvia and Lithuania) were among those quickest to increase defence spending following Russia’s invasion of Ukraine in 2022. All plan to keep military spending at high levels in the coming years, or even increase it. Earlier this year, all four countries pledged to lift their defence budgets to 5% of GDP. Spending on this scale could absorb up to 15% of their tax revenues based on outcomes for recent years (OECD 2024). In recent months, Czechia, Denmark, Finland, Norway and Sweden have also signalled ambitious goals for defence spending, as have larger European economies including France, Germany and the United Kingdom (Figure 2 panel A). In a NATO summit this week, members are expected to agree to a new, higher defence spending target.

Many countries plan to borrow more, at least in the near term, to finance higher military expenditure. Sweden and Germany have loosened their fiscal rules – changing the Constitution in Germany’s case – to make more room for higher future defence outlays. A larger group of countries (16 by the end of April) hope to make use of national escape clauses in EU fiscal rules (Council of the EU, 2025). If cleared by the Council, this would allow these member states to deviate from approved budget plans by spending an extra 1.5% of GDP on defence up to 2028 (compared with levels in 2021).

Financial market pressure may make it difficult to meet defence spending ambitions in high debt countries. While Germany and Sweden have fiscal space to let debt rise for a period of time, higher-debt OECD economies could face increased borrowing costs if they fail to cut non-defence spending or raise taxes. Tax increases have often accompanied past military build-ups after a temporary period of higher borrowing (Marzian and Trebesch, 2025). But in many of the OECD countries now promising to raise defence spending, tax burdens are already high (Figure 2 panel B). Postponing to the “long run” tough fiscal policy choices – already unavoidable for countries grappling with heavy costs from changing demographics and climate (OECD 2025) – may not be an option.

The broader economic effects of higher defence spending are uncertain and will vary from country to country. Near-term growth payoffs from increased defence expenditure are likely to be larger in economies with spare capacity and established local defence industries, particularly if monetary policy accommodates a fiscal expansion. But many countries could expect the positive gains from higher defence spending to be offset by some combination of higher imports and reduced private sector activity due to increases in inflation or interest rates.  

The impact of higher spending may also vary by type of spending. Defence infrastructure projects or spending on equipment could generate relatively high multipliers by boosting public sector investment directly, and if they generate domestic private sector activity and jobs, and rely mainly on locally-sourced materials. Raising the number of military personnel also contributes to domestic output – directly through public final consumption and indirectly via household consumption – and is likely to have larger net effects in economies below full employment.

To the extent that European countries are able to source defence equipment, inputs or services from each other, and stretched availability of supplies does not raise costs, regional multipliers from increased defence spending could exceed those in individual European countries. Recent analyses suggest that a collective 1.5% of GDP lift in military spending could boost Europe-wide GDP by between 0.5% and 1.5% (Ilzetzki, 2025; European Commission, 2025). Across all but the very top of this range, a combination of higher imports and some crowding out of private sector activity would mean a less than one-for-one translation of increased government spending to GDP.

Longer-run benefits might still come from defence investments that boost the economy’s productive capacity, for instance through better infrastructure or innovation to respond to the shifting technological demands of modern warfare. These benefits are hard to quantify, though there is good reason to expect defence R&D to eventually benefit other industries (Steinwender, Van Reenen and Moretti, 2019). Gains from innovation and higher productivity might be more likely to spill over national borders if allied countries coordinate strategic investments and military procurement. Such coordination could be a powerful lever for more efficient defence spending if it reduces the cost of achieving intended improvements in military capability.

References

Council of the EU (2025), “Coordinated activation of the National Escape Clause”, press release of 30 April 2025.

European Commission (2024), Opening remarks by President von der Leyen at the joint press conference with President Michel and Belgian President De Croo following the meeting of the European Council of 27 June 2024.

European Commission (2025), “European Economic Forecast Spring 2025: Moderate growth amid global economic uncertainty”, Institutional Paper, 318.

Ilzetzki, E. (2025), “Guns and Growth: The Economic Consequences of Defense Buildups”, Kiel Report, No. 2.

Marzian, J. and C. Trebesch (2025), “How to Finance Europe’s Military Buildup? Lessons from History”, Kiel Policy Brief, 184.

OECD (2024), Revenue Statistics 2024: Health Taxes in OECD Countries, OECD Publishing, Paris, https://doi.org/10.1787/c87a3da5-en.

OECD (2025), Economic Outlook, Volume 2025/1, OECD Publishing, Paris, https://doi.org/10.1787/83363382-en.


Developments in Artificial Intelligence markets: New evidence on model characteristics, prices and providers

By Christophe André, Manuel Bétin, Peter Gal and Paul Peltier.

The release of Deepseek’s R1 model on January 20th stunned the world. This “sputnik moment” in AI showed that an almost unknown Chinese company could develop an AI model at the very top of AI capabilities at a fraction of the development costs of other leading models, release its parameter set (“weights”) for open use and offer ten times cheaper access to users. 

Our recent OECD paper, “Developments in Artificial Intelligence markets: New indicators based on model characteristics, prices and providers” (André, Bétin, Gal and Peltier, 2025), shows that while important risks for competition in digital markets persist, the strong position of digital incumbents in the supply of AI has not curbed innovation and prevented potential AI-users from accessing better and cheaper AI models, which provides strong preconditions for adoption across many sectors of the economy.

New data and indicators to monitor AI markets

After the skyrocketing popularity of OpenAI’s GPT models in late 2022, concerns emerged that AI may further entrench dominant positions in digital markets, with incumbents gaining a definitive advantage by controlling the three key AI inputs to AI development: access to data, computing capacity and top AI talents (OECD, 2024). However, emerging empirical evidence offers some nuance regarding such concerns.

The paper relies on an extensive data collection on AI foundation models on the market and shows that, so far, there have been several signs indicating dynamism in three segments of the AI value chain (AI model development, AI model provision from the cloud and AI downstream applications). First, the number of available AI foundation models has been rising exponentially (Figure 1), developed by an increasing number of companies and offering several interaction modalities. 

Second, using common industry benchmarks to evaluate AI models’ performances and collecting prices of AIfrom cloud providers, we construct an AI Economic Frontier by identifying, each month, the best models in terms of the price-performance trade-off (Figure 2). Results suggest that in the last two years, the positions at this AI Economic Frontier have shifted continuously towards lower prices and higher quality. Moreover, the developers and models that make it to the frontier have been changing, with five to six players alternating at the frontier (OpenAI, Meta, DeepSeek, Anthropic, etc.) and around ten others following closely.

Figure 2. The AI Economic frontier shows the continuous improvements of AI 

Note: Performance is defined by a normalised weighted performance index on industry benchmarks. Each dot represents the model with the best available price-performance trade-off within Text-to-Text models.
Source: André, Betin, Gal and Peltier, 2025.

This variety of models at the frontier is important from an economic perspective. Many users may not always need the best available models and would rather pay an order of magnitude less to access “good enough” models specialised for specific tasks or preferences. In addition to the offer of closed models directly from the cloud, open-weight models offer an option for cheaper (with no license fee), transparent and easily customable (fine-tuned) models used outside of the public cloud environment. This option provides opportunities for better tailored performance and greater control in specific business applications and enhanced data privacy.

AI is getting better, cheaper and more accessible

Figure 2 illustrates the upward shift of the AI economic frontier, implying that AI has become more efficient and cheaper. Indeed, our quality-adjusted AI price index has fallen by on average 80% in two years (Figure 3) and, on average, 30% of models at the frontier have been replaced every month by cheaper and better models.

AI-adopting firms have benefited from greater access to AI models via a widespread offer accessible through several cloud providers (for business use) and an increasing number of AI-powered consumer services (consumer-facing applications). According to our data collection, around 60 cloud providers offer access to AI models, on average from five different AI developers. Downstream, in consumer facing applications, we recorded more than 12 000 AI tools ranging from chatbots to image editing software, customer support applications or domain specific services. While this offer is large and growing, only a few of them (like ChatGPT) attract most users.

 AI market developments have been favourable for AI users, but risks for competition exist

Dynamic AI markets are a necessary condition for the diffusion of AI across the economy via widespread AI adoption in various sectors, a central determinant of long-term productivity gains from AI (Filippucci et al., 2024). Our evidence so far suggests that the supply of AI has been more open than initially expected in various segments of the AI value chain, driving innovation and generating the optimal conditions for broad AI adoption (lower price, better quality, broader accessibility). If current trends persist, dynamic AI markets can foster adoption and boost innovation which in turn are preconditions for widespread economic and welfare benefits.

Nonetheless, several uncertainties and risks persist about the future dynamism of AI markets. For instance, the capacity of digital incumbents to leverage existing compute infrastructure and user base in adjacent markets is high. Furthermore, the high concentration of the necessary inputs for AI development — data, compute, and talent — creates additional risks for long-term competition.

References

André, C. et al. (2025), “Developments in Artificial Intelligence markets: New indicators based on model characteristics, prices and providers”, OECD Artificial Intelligence Papers, No. 37, OECD Publishing, Paris, https://doi.org/10.1787/9302bf46-en.

Filippucci, F., P. Gal and M. Schief (2024), “Miracle or Myth? Assessing the macroeconomic productivity gains from Artificial Intelligence”, OECD Artificial Intelligence Papers, No. 29, OECD Publishing, Paris, https://doi.org/10.1787/b524a072-en.

OECD (2024), “Artificial intelligence, data and competition”, OECD Artificial Intelligence Papers, No. 18, OECD Publishing, Paris, https://doi.org/10.1787/e7e88884-en.

Live data from OECD.AI


Boosting business sector productivity in Canada

Katja Schmidt & Gilles Thirion, OECD.

Canada’s economy has shown resilience to crisis, including the recent Covid19-crisis. However, growth in per capita GDP has lagged in recent years. Business investment per worker in Canada has remained significantly below that of peer OECD countries, particularly in key areas such as information and communication technology (ICT), machinery and equipment, and intellectual property products. Moreover, the business innovation intensity remains comparatively low, despite the availability of various government support programmes. As a result, productivity growth has remained subdued (Figure 1). Between 2015 and 2023, labour productivity per hour worked grew by just 0.8% annually, below the OECD average and significantly behind the United States.

The Canadian economy is now facing new headwinds in the form of rising tariffs from its most important trading partner, the US. The effective tariff rate on US imports from Canada is expected to rise by about 13 percentage points, up from a near-zero effective bilateral tariff rate. Although the tariff exemptions under the United States-Mexico-Canada Agreement will help shield the Canadian economy from more severe impacts, the tariffs will still significantly weigh on economic growth. They could also further undermine productivity growth. However, if tariffs help to prompt structural reforms, particularly those weighing on productivity, this could help mitigate some of the negative effects of tariffs in the long-term.

In this context, the new 2025 OECD Economic Survey of Canada highlights four key priorities to strengthen business sector productivity:

  • Reduce interprovincial barriers to trade and labour mobility to strengthen the efficiency and integration of the internal market;
  • Enhance competition and support firm growth by removing remaining regulatory restrictions in network sectors, improving access to financing for young and innovative firms, and reinforcing competition policy;
  • Scale up and streamline government innovation support schemes to increase accessibility;
  • Ensure full utilisation of skills by addressing labour market mismatches, reducing underemployment, and improving pathways for credential recognition and upskilling.

Canada’s interprovincial trade barriers have been widely recognised as undermining the efficient allocation of resources across the country and effectively reducing the size and integration of its internal market. These barriers span a range of areas, including occupational licensing, transportation and procurement regulations, and divergent technical standards. Accelerating the reduction of these barriers, such as by expanding the scope and enforcement powers of the Canadian Free Trade Agreement, would enhance market efficiency, foster competition, and support productivity growth.

Interprovincial barriers also constrain labour mobility, particularly in skilled trades and professional services. Differences in provincial certification requirements continue to hinder mutual recognition, limiting the ability of workers to move freely. Policy efforts should focus on further harmonising standards and expanding mutual recognition frameworks across provinces.

Policies to enhance competition and business dynamism span multiple policy domains. One possible area of reform is the removal of existing foreign entry restriction in some key network sectors, such as telecommunications. Another area is to support the growth of small and medium-sized enterprise (SME), which struggle to scale. Addressing this requires different tools, such as reviewing the preferential small business corporate tax rate; improving access to affordable financing; and strengthening managerial capabilities. In addition, ensuring a robust competition policy framework in digital markets is essential to foster innovation

Third, existing government support programmes for business innovation should be better coordinated and simplified, to increase Canada’s comparatively low business R&D spending (Figure 2). R&D incentives should be harmonised across small, medium-sized, and large firms to ensure neutrality. Additionally, there is scope to reallocate public R&D funding towards some more direct support instruments, which tend to be more targeted. The proposed Canada Innovation Corporation (CIC), envisioned as a new nationwide platform for supporting business R&D, represents a promising step toward streamlining and enhancing the effectiveness of R&D incentives.  

Finally, the Survey highlights opportunities to better harness the potential of Canada’s highly educated labour force, notably by better integrating immigrants and enhancing female participation. Overqualification remains prevalent among immigrants. Expanding mutual recognition agreements for foreign qualifications could help mitigate the risk of skill underutilisation of immigrants. In addition, women continue to be under-represented in some key technical fields and leadership positions. Policy efforts should focus on continuing expanding access to affordable childcare, promoting equal parental leave, enforcing pay equity, and supporting flexible work arrangements.

Visit the OECD’s Canada Economic Snapshot page for further information.

References:

OECD (2025), OECD Economic Surveys: Canada 2025, https://doi.org/10.1787/28f9e02c-en, OECD Publishing, Paris.


Deutschland: Regionale Entwicklung im Strukturwandel fördern

Small town in Germany

Lesen Sie den Blog auf Englisch

By Robert Grundke, Enes Sunel

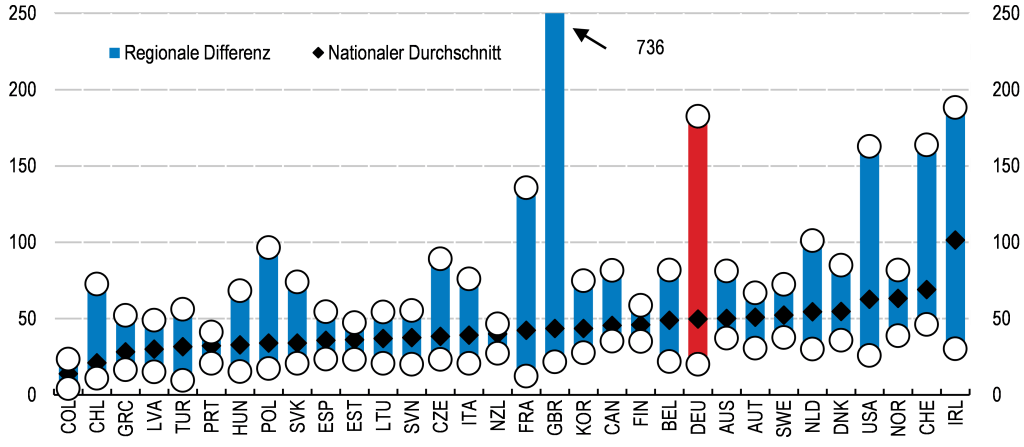
Deutschland ist ein stark dezentralisierter Föderalstaat mit großen wirtschaftlichen und sozialen Gefällen (Abbildung 1). Dies ist u. a. auf die Wiedervereinigung zurückzuführen, da die Umstellung von Plan- auf Marktwirtschaft mit erheblichen strukturellen Veränderungen und hohen wirtschaftlichen und sozialen Anpassungskosten in den östlichen Bundesländern einherging. Hinzu kam der durch die Globalisierung und den technologischen Fortschritt ausgelöste Strukturwandel, der erhebliche Auswirkungen auf einige Regionen in Westdeutschland hatte. Die regionalen wirtschaftlichen Unterschiede, vor allem zwischen den östlichen und westlichen Bundesländern, haben seit den 2000er Jahren zwar deutlich abgenommen (BMWK, 2024), drohen sich durch den ökonomischen, digitalen und demografischen Wandel aber zu vergrößern.

Abbildung 1. Es bestehen nach wie vor erhebliche regionale Unterschiede

Pro-Kopf-BIP auf Ebene der TL3-Regionen, in tausend USD zu konstanten Preisen von 2015, kaufkraftbereinigt, 2021

Anmerkung: In Deutschland entsprechen die TL3-Regionen den Kreisen. Berücksichtigt sind nur Länder, für die auf TL3-Ebene aufgeschlüsselte regionale Daten vorliegen. Die nationalen Durchschnittswerte sind nach Einwohnerzahl der TL3-Regionen gewichtet.
Quelle: OECD Regional Statistics (Datenbank).

Wie kann Deutschland die regionale Entwicklung im Strukturwandel fördern? Der Wirtschaftsbericht Deutschland 2025 identifiziert fünf Prioritäten:

1. Die Zweckzuweisungen des Bundes und die industriepolitischen Maßnahmen besser mit den Maßnahmen der regionalen Wirtschaftsförderung koordinieren.

Umfangreiche Transfers zwischen den verschiedenen staatlichen Ebenen, insbesondere zweckgebundene Zuweisungen zur Förderung der Stadtentwicklung sowie der Verkehrs-, Digital- und Forschungsinfrastruktur, sollen gleichwertige Lebensverhältnisse in allen Teilen Deutschlands sichern. Ein Großteil dieser Mittel wird jedoch nicht hinreichend koordiniert und fließt nicht unbedingt in die Regionen, in denen der Bedarf am größten ist. Demgegenüber sind die Mittel der Regionalförderung deutlich weniger umfangreich, die Mittelverteilung erfolgt aber nach einem Regionalindikatormodell. Durch eine bessere Abstimmung der zweckgebundenen Bundesmittel mit den Mitteln der regionalen Wirtschaftsförderung und der EU-Kohäsionspolitik und eine stärkere Nutzung des Regionalindikatorenmodells für die Mittelverteilung ließen sich die Zielgenauigkeit verbessern und die Ausgabeneffizienz steigern. Dies ist umso wichtiger, als über das jüngst geschaffene Sondervermögen Infrastruktur in den kommenden zwölf Jahren 100 Mrd. EUR an die Länder und Kommunen fließen werden, um deren Investitionstätigkeit zu unterstützen. Eine Vereinfachung und Harmonisierung der Beantragung von Fördermitteln, beispielsweise durch eine Erweiterung der zentralen Anlaufstelle – der Förderzentrale Deutschland – dahin gehend, dass sie Zugriff auf eine größere Zahl von Förderprogrammen des Bundes, der EU und der Länder gibt, würde darüber hinaus die Verwaltungskosten verringern und Kommunen mit begrenzten Verwaltungskapazitäten den Zugang zu Fördermitteln erleichtern.

2. Wenn künftige Gesetzesänderungen auf Bundesebene negative Auswirkungen auf die Haushaltslage der Gemeinden haben, einen Ausgleich für diese vorsehen.

Der Infrastrukturstau auf kommunaler Ebene behindert öffentliche Investitionen in den Bereichen Bildung, Verkehr, Energie- sowie Wasser- und Abwasserversorgung und belastet die Qualität der öffentlichen Daseinsvorsorge, was die Regionen bei der Bewältigung des Strukturwandels vor große Herausforderungen stellt (Abbildung 2). Feste Ausgaben, die auf anderen staatlichen Ebenen festgelegt werden, wie z. B. auf Bundesebene beschlossene Sozialleistungen, begrenzen die Mittel der Kommunen für langfristige Infrastrukturinvestitionen. Zwar sorgen Bundeszuweisungen und höhere Umsatzsteueranteile für eine gewisse Entlastung, doch decken diese häufig nur einen Teil der kommunalen Sozialausgaben. Wenn Gesetzesänderungen auf Bundesebene die Kosten für die Gemeinden erhöhen, sollten die Kommunen einen höheren Anteil an der Umsatzsteuer oder anderen Gemeinschaftsteuern, wie z. B. der Einkommensteuer, erhalten. Zugleich sollte sichergestellt werden, dass die Zuweisungen der Länder im Rahmen der kommunalen Finanzausgleiche oder die Bundesergänzungszuweisungen nicht im Gegenzug gekürzt werden. Um ein öffentliches Dienstleistungsangebot und eine stabile und ausreichende Finanzierung der Kommunen sicherzustellen, ist es entscheidend, den Effekt von Steuerreformen auf Bundesebene auf die Kommunen zu evaluieren.

Abbildung 2. Der Kapitalstock der Kommunen geht seit zwanzig Jahren zurück

Bruttoanlageinvestitionen abzüglich Abschreibungen, in % des BIP

Quelle: OECD National Accounts (Datenbank).

3. Die kürzlich erfolgte Neubewertung des Grundbesitzes nutzen, um die Grundsteuer stärker an den Verkehrswert zu koppeln und das Steueraufkommen der Gemeinden zu steigern.

Da die Einnahmen aus der Gewerbesteuer, die mit dem Konjunkturzyklus stark schwanken, die größte Einnahmequelle der Gemeinden sind, wird die langfristige Finanzplanung vor allem für größere Infrastrukturprojekte erschwert. Das Aufkommen aus Steuern auf unbewegliches Vermögen, die stabilere Einnahmen bringen, ist im Vergleich zu anderen OECD-Ländern niedrig. Gemessen am BIP stagniert es seit den 1990er Jahren, obwohl sich die Grundstückspreise in den letzten zehn Jahren mehr als verdoppelt haben und die Immobilienpreise um rd. 80 % gestiegen sind. Die vor Kurzem erfolgte Neubewertung des Grundbesitzes sollte genutzt werden, um die Einnahmen aus der Grundsteuer zu erhöhen und zugleich einen bundesweiten Mindesthebesatz einzuführen, um einem schädlichen Steuerwettbewerb entgegenzuwirken. Um zahlungsschwache aber vermögensreiche Haushalte zu entlasten, könnten Steuerstundungen eingeführt werden. Dabei muss nur sichergestellt sein, dass die noch nicht entrichteten Steuern bei Verkauf oder Vererbung der Immobilie bezahlt werden.

4. Die Verwaltungskapazitäten auf lokaler Ebene durch eine stärkere Zusammenarbeit und die Bündelung von Aufgaben zwischen den Kommunen erhöhen.

Aufgrund der großen Zahl kleiner Kommunen sind die Kosten der Erbringung öffentlicher Dienstleistungen im Verhältnis zur Bevölkerung hoch, zumal starke Personalengpässe bestehen. Begrenzte Verwaltungskapazitäten haben zu dem großen Investitionsstau beigetragen und erschweren auch die Beantragung und Verwaltung von Zweckzuweisungen anderer staatlicher Ebenen oder der EU. Wenn Gebietsreformen oder eine verbindliche Zusammenarbeit nicht machbar sind, könnten kommunale Zweckverbände die Zusammenarbeit zwischen kleineren Kommunen erleichtern. In Bereichen wie Abfallwirtschaft, öffentlicher Verkehr oder Tourismus gibt es diese Art der Kooperation bereits. Schulungs- und Informationsmaßnahmen sowie finanzielle Anreize könnten die Verbreitung solcher Initiativen fördern. Durch die Bündelung von Aufgaben oder die Übertragung bestimmter Aufgaben, die vollständig digitalisiert werden können und keine Beratung vor Ort erfordern, an andere Verwaltungsebenen kann der Druck auf die Verwaltungskapazitäten auf der lokalen Ebene ebenfalls verringert werden.

5. Die Versorgung mit leistungsfähigen Internetanschlüssen auf alle Regionen ausweiten.

Die FuE-Ausgaben im Unternehmenssektor liegen in Deutschland über dem OECD-Durchschnitt. Dagegen sind die Investitionen in Wissenskapital relativ niedrig, was den Einsatz digitaler Technologien behindert. Langsame durchschnittliche Downloadgeschwindigkeiten sind ein entscheidender Grund hierfür (Abbildung 3). Laut der Breitbandstatistik der OECD beruhten Ende 2023 nur etwa 11 % der Festnetzbreitbandanschlüsse auf Glasfaserleitungen, gegenüber etwa 42 % im OECD-Durchschnitt. Um die Engpässe bei der Glasfaseranbindung zu beseitigen ist es wichtig den Wettbewerb zu fördern, indem man die gemeinsame Infrastrukturnutzung erleichtert. Dies sollte mit einer Vereinfachung und Beschleunigung der Planungs- und Genehmigungsverfahren sowie der Festlegung bundesweiter Standards für kostengünstigere Netzausbauvarianten einhergehen.

Abbildung 3. Internet-Downloadgeschwindigkeiten sind in vielen deutschen Regionen niedrig

Durchschnittliche Downloadgeschwindigkeit im Festnetz auf regionaler Ebene, Mbit/s, Q1 2023

Anmerkung: Die regionale Differenz bezieht sich auf die Ebene der NUTS2-Regionen (die in Deutschland den Regierungsbezirken entsprechen).
Quelle: Durán Laguna (2024).
Literaturhinweise

BMWK (2024), Gleichwertigkeitsbericht 2024, Bundesministerium für Wirtschaft und Klimaschutz, Berlin, https://www.bmwk.de/Redaktion/DE/Publikationen/Wirtschaft/gleichwertigkeitsbericht-der-bundesregierung-2024.html.

Durán Laguna, J. (Hrsg.) (2024), Ninth report on economic, social and territorial cohesion, Amt für Veröffentlichungen der Europäischen Union, Luxemburg, https://doi.org/10.2776/585966.

OECD (2025), OECD-Wirtschaftsberichte: Deutschland 2025, OECD Publishing, Paris, https://doi.org/10.1787/edfb037f-de.


Germany: Fostering regional development in times of structural change

Small town in Germany

By Robert Grundke, Enes Sunel

Read the blog in German

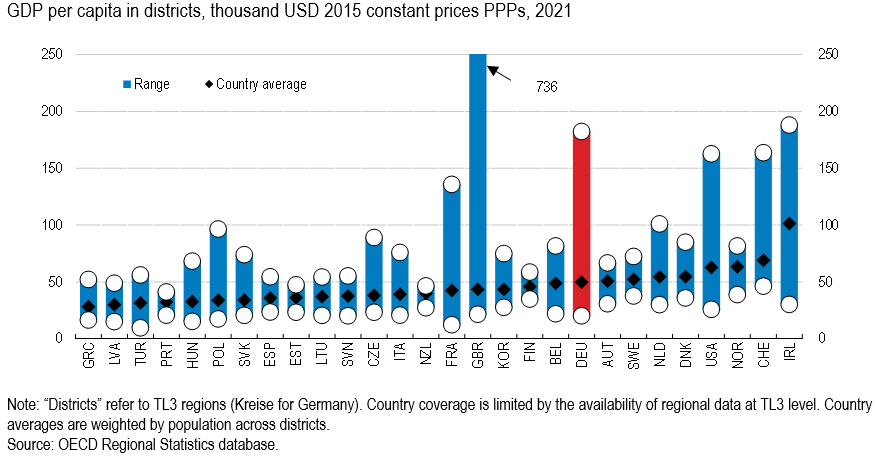
Germany is a highly decentralised federal country with significant regional disparities (Figure 1). This is partly related to the German reunification, as the transition from central planning to a market economy implied major structural changes with high economic and social adjustment costs in the East. Moreover, structural change related to globalisation and technological change have also strongly affected some Western regions. Although economic disparities, especially between the eastern and western Laender, have narrowed substantially since the 2000s (BMWK, 2024), the green, digital and demographic transitions risk widening existing gaps.

Figure 1. Regional disparities remain large

How can Germany foster regional development in times of structural change? The 2025 Economic Survey of Germany identifies five priorities:

1. Better coordinate conditional federal grants and industrial policies with place-based policies

Large inter-governmental transfers, including conditional grants to support urban development, transport, digital or research infrastructure, are used to balance living standards across the regions, but most of these funds are not well coordinated and not allocated to the regions with the greatest needs. In contrast, place-based policies have a much smaller funding size, but use a regional development index for allocating funds. Better coordination of these conditional grants with place-based programmes and EU cohesion funds and the wider use of the regional development index for allocating funding could improve targeting and raise spending efficiency. This is particularly important as a recently created infrastructure fund will allocate EUR 100 billion over the next 12 years to support public investment in the Laender and municipalities. Moreover, simplifying and harmonising funding applications by expanding the one-stop shop, Foerderzentrale Deutschland, to cover more federal, EU, and Laender programmes would reduce administrative burdens and help municipalities with limited administrative capacities to access funding more easily.

2. Compensate municipalities for future federal legislative changes affecting municipal budgets

A municipal infrastructure backlog has hindered public investments in education, transport and utilities, and reduced public service quality, challenging the ability of regions to address structural change (Figure 2). Rigid expenditures set by other government levels, such as federally legislated social benefits, limit funds for municipal long-term infrastructure investments. While federal transfers and increased VAT shares provide some relief, these do not fully cover municipal social spending. If federal legislative changes increase municipal costs, municipalities should receive a higher share of VAT or joint tax revenues such as personal income tax while ensuring that grants from Laender through municipal equalisation systems are not reduced in exchange. Evaluating the impact of federal tax reforms on municipalities is key to maintain local public service provision and ensure stable and sufficient funding for municipalities.

3. Use the recent update of property values to better link property taxation to market values and raise municipal revenue

As local business taxes, which strongly fluctuate with the business cycle, are the major revenue source for municipalities, financial planning is complicated, particularly for bigger infrastructure projects. Revenue from taxes on immovable property could provide more stable revenue streams but they are low compared to other OECD countries. Such revenues have stagnated as a share of GDP since the 1990s, although land prices have more than doubled and real estate prices have increased by about 80% during the last 10 years. The recent update of property values should be used to raise revenue from property taxes, while introducing a national minimum tax rate to help avoid detrimental tax competition. To support cash-poor but asset-rich households, tax deferrals could be introduced provided that the unpaid tax is settled when the property is sold or inherited.

4. Raise local administrative capacities by improving cooperation and bundling tasks across municipalities

The large number of small municipalities implies high unit costs of public service delivery, while labour shortages are high. Limited administrative capacities have contributed to the large investment backlog and complicate the application for and management of conditional grants from other levels of government or the EU. If territorial reforms or mandatory cooperation are not feasible, inter-municipal associations could facilitate cooperation between smaller municipalities, as already applied in areas such as waste management, public transport or tourism. Capacity-building initiatives and financial incentives could support the take up of such initiatives. In addition, bundling tasks or transferring some tasks, which can be fully digitalised and do not require close local counselling, to other levels of government can help reduce pressure on administrative capacities at the local level.

5. Expand access to high-performance network connectivity to all regions

Germany’s business R&D spending is above the OECD average, but investment in knowledge-based capital is low, hindering the adoption of digital technologies. Slow average download speeds are a key reason (Figure 3). According to the OECD Broadband Statistics, only around 11% of all fixed broadband subscriptions were fibre-based compared to around 42% in the average OECD country at the end of 2023. To remove connectivity bottlenecks for fibre access it is key to foster competition by facilitating infrastructure sharing. This should be accompanied by further simplifying and accelerating planning and approval procedures and establishing national standards for low-cost roll out technologies.

Figure 3. Internet download speeds are slow in many German regions

Note: The range indicates regional variation at the NUTS2 level (Regierungsbezirk for Germany).
Source: European Commission (2024)

For more information, please refer to the Economic Snapshot of Germany.

References

BMWK (2024), “Gleichwertigkeitsbericht – Für starke und lebenswerte Regionen in Deutschland”, https://www.bmwk.de/Redaktion/DE/Publikationen/Wirtschaft/gleichwertigkeitsbericht-der-bundesregierung-2024.html.

European Commission (2024), “European Commission Regional and Urban Policy Ninth report on economic, social and territorial cohesion”, https://doi.org/10.2776/585966.

OECD (2025), OECD Economic Surveys: Germany 2025, OECD Publishing, Paris, https://doi.org/10.1787/39d62aed-en


How Sweden can strengthen climate resilience now

The front facade of a famous high school in Sweden with 2 people walking in front of it

By HyunJeong Hwang

Sweden is warming at nearly twice the global average pace. Coastal erosion, flooding, and extreme weather events are no longer future risks, they are affecting communities today. On the south coast of Skåne, more than 200 meters of shoreline have been lost to erosion in just four decades. With 82% of the population living in coastal areas, the stakes are high. Investments to adapt to climate change make good economic sense and can improve social equity. The 2025 OECD Economic Survey of Sweden highlights three strategic areas to strengthen Sweden’s climate resilience:

  • Accelerating market-based adaptation measures
  • Improving public funding mechanisms
  • Strengthening governance and coordination

Market tools can drive private investment in adaptation but are not used to their full potential in Sweden (Figure 1). Property owners are the main beneficiaries from safeguarding their own assets and should therefore at the outset foot the bill. Sweden’s legal framework therefore rightfully places the responsibility for climate adaptation largely on property owners, but in practice few financial incentives exist to drive meaningful action.

Insurance premiums typically do not reflect the actual risk of climate-related damages. For example, homes located in high-risk flood zones pay the same premiums as those in safer locations. Moreover, homeowners who take proactive steps, like building flood barriers or reinforcing foundations, rarely see their premiums lowered. This “risk-blind” pricing does not properly incentivise ex-ante adaptation strategies and investments in resilience.

A similar gap exists in property taxation. Municipalities in Sweden cannot adjust tax rates based on local climate risk, nor can they use tax tools to discourage new development in vulnerable coastal areas. The result is a system where those who benefit most from adaptation investments are not contributing proportionately to the cost of those investments.

To reverse this dynamic, Sweden needs to embed climate risks in the prices facing households and businesses to encourage risk-reducing actions. Insurance premiums should be better aligned with site-specific risks, such as flooding or erosion. International examples show that this works. In Denmark and the United Kingdom, for instance, insurers offer premium discounts for policyholders who for example install flood barriers or upgrade drainage. Such approaches have led to measurable increases in private adaptation investments and reduced long-term losses. Introducing similar arrangements in Sweden would not only encourage adaptation but also reduce future spending on disaster recovery (Figure 2).

In addition, Sweden should consider allowing municipalities to implement risk-based property taxation. This would ensure that households in high-risk areas contribute more to the cost of local adaptation projects, such as sea walls or improved stormwater infrastructure. It would also help resolve the “public goods dilemma,” where individuals benefit from shared resilience measures but lack incentives to pay for them. In coastal municipalities like Malmö and Vellinge, disagreements over who should finance protective infrastructure have already caused delays.

Another weakness in Sweden’s climate adaptation funding model is that the risk of large-scale weather-related losses is not properly reflected in insurance premiums. Households, businesses and the insurance industry expect that the government will bail them out in the event of major disasters. Explicit ex ante risk pooling is at the outset a superior solution to such ex post tax-financed bailouts. A prefunded pool, financed by a mandatory surcharge on all property insurance premiums, would act as a buffer in times of crisis and protect the insurance sector and taxpayers alike from unpredictable fiscal shocks. Insurers actively encouraging and facilitating risk mitigation efforts could be rewarded with more favourable terms when accessing the backstop to incentivise risk reduction and reduce the likelihood of high claims. France provides a proven example through its Natural Disaster Compensation Scheme (Caisse Centrale de Réassurance), which is funded by insurance premiums and ultimately guaranteed by the State.

Improving public funding mechanisms is also important. Variation in investment needs for climate adaptation between municipalities is largely orthogonal to their main funding sources, which are personal income taxes, the general grant from the government and the cost and income equalisation system. Municipalities can apply for national and EU grants, but these are mostly aimed at large-scale projects and entail a complex and resource-intensive process, disadvantaging smaller municipalities. Unlike mitigation, adaptation funding is not fully mainstreamed into Sweden’s budget process. Mainstreaming adaptation into national budgeting, alongside easily accessible grants conditional on specific performance targets or milestones, would provide more predictable support and help municipalities plan for the long term.

Governance is another area in need of reform. Sweden lacks a cohesive national action plan for climate adaptation, and responsibilities across sectors and administrative levels often overlap. Municipalities are not legally required to report on adaptation efforts, making it difficult to track progress and identify gaps. Strengthening the authority of County Administrative Boards, which are tasked with coordinating local adaptation efforts, and requiring regular and more standardised reporting would improve consistency across municipalities.

As the impact of climate change intensifies, adaptation can no longer be an afterthought. It must be embedded in financial systems, public policy, and institutional governance. The path forward depends on decisions today, ones that align market incentives and equitably allocate public resources. The resilience of future generations depends on it.

For more information, visit the Sweden snapshot page.

References

OECD (2025), OECD Economic Surveys: Sweden 2025, OECD Publishing, Paris.


Convertir la incertidumbre global en oportunidad: Una agenda de competitividad para América Latina

Por Jens Arnold, Aida Caldera, Priscilla Fialho, Paula Garda, Alberto González Pandiella, Michael Koelle, Alessandro Maravalle, Dimitris Mavridis, Claudia Ramírez y Adolfo Rodriguez-Vargas, OCDE.

El contexto global, marcado por una alta incertidumbre política y fragmentación, plantea nuevos desafíos para América Latina, pero también abre nuevas oportunidades para fortalecer su competitividad y reducir vulnerabilidades.

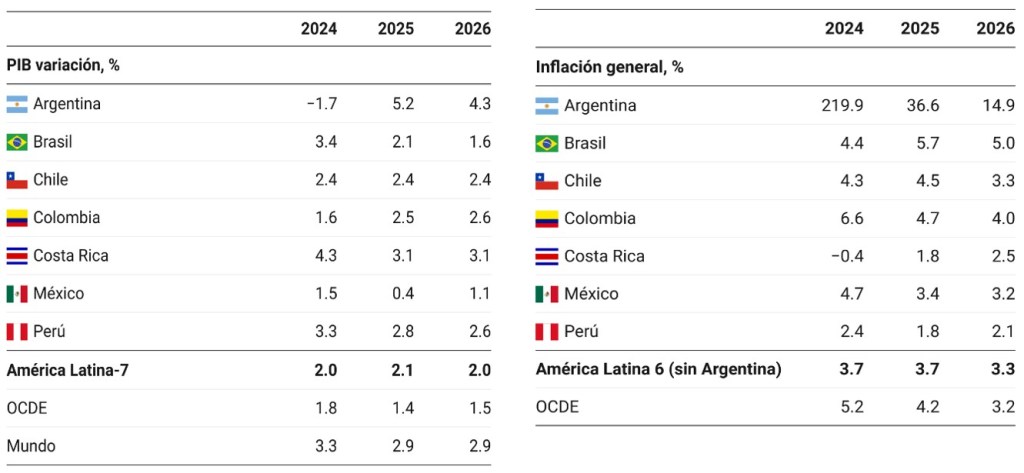
Se espera que el PIB en América Latina crecerá 2.1% en 2025 y 2% en 2026, lo que refleja una desaceleración generalizada en la región. Estas cifras son más bajas que las previstas a fines del año pasado y se sitúan por debajo del promedio de otras economías emergentes. Aunque se espera una fuerte recuperación en Argentina, el crecimiento se mantiene débil en la mayoría de los países, con revisiones a la baja para Brasil, México y Colombia (Tabla), en un contexto generalizado de una débil demanda externa y la alta incertidumbre.

Cuadro. Perspectivas económicas para los países de América Latina

Nota: América Latina 7 es la media ponderada por el PIB a valores de paridad del poder de compra de los 7 países en la tabla para el PIB. América Latina 6 es la media simple de los países incluidos en el cuadro para la inflación excluyendo a Argentina.
Fuente: OCDE Perspectivas Económicas No. 117, junio de 2025.

La desinflación avanza, pero persisten las presiones inflacionarias. La inflación se mantiene por encima del objetivo en muchos países. En cambio, Argentina ha logrado avances significativos gracias a una combinación de consolidación fiscal y una política monetaria más restrictiva. Con la excepción de Argentina y Brasil, los bancos centrales de la región deberían continuar con su flexibilización monetaria prudente y gradual para asegurarse que la inflación se acerque al objetivo, manteniéndose alerta ante riesgos de salidas de capitales y nuevas presiones inflacionarias.

Los riesgos para las perspectivas son a la baja. Un aumento de los aranceles comerciales y menor dinamismo al previsto en socios comerciales clave podría debilitar aún más las exportaciones y presionar a la baja los precios de las materias primas. Los costos comerciales podrían ralentizar más de lo esperado la desinflación en las economías avanzadas y prolongar tasas de interés globales más altas. Una elevada deuda pública y unas condiciones financieras globales más restrictivas de lo previsto, podrían retrasar la tan necesaria inversión. Si se intensifican las salidas de capital, los bancos centrales podrían tener menos margen de maniobra para flexibilizar la política monetaria.

Una agenda de competitividad para tiempos inciertos

En este complejo entorno global, la región necesita más que nunca mejorar sus políticas domésticas. Un área donde es posible avanzar, y urgentemente necesario, es en competitividad, comercio e inversión. Estas no son prioridades nuevas, pero los cambios globales en el comercio, las cadenas de suministro y la transición hacia economías más sostenibles aumentan su relevancia estratégica. Los países que ofrezcan estabilidad institucional, apertura y baja carga administrativa estarán mejor posicionados para atraer inversión y expandir sus mercados.

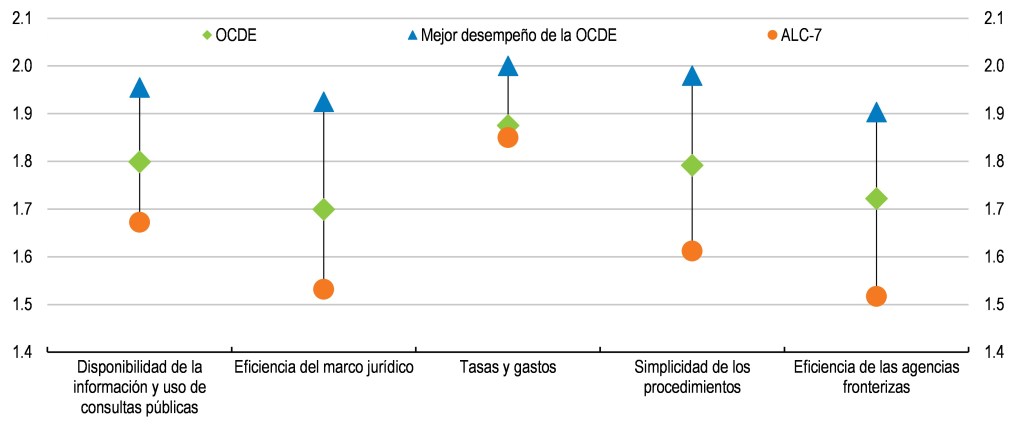
Mejorar los procedimientos aduaneros representa una oportunidad clara. Según los Indicadores de Facilitación del Comercio de la OCDE, América Latina aún enfrenta altos costos comerciales debido a procedimientos aduaneros complejos, inspecciones redundantes y poca coordinación entre agencias fronterizas (Figura). Hay amplio margen para mejorar el procesamiento, levante y despacho de mercancías, en particular mediante una mayor automatización y una mejor coordinación entre las agencias aduaneras, sanitarias, tributarias y otras agencias fronterizas. Medidas prácticas como la cooperación entre agencias de distintos países en la frontera, la agilización de los procesos judiciales y una mayor digitalización pueden beneficiar a los exportadores, especialmente a las pequeñas empresas, y atraer inversión. Además, estas medidas reducen los costos de operar formalmente, lo que incentiva a más empresas a salir de la informalidad.

Figura. Las políticas de facilitación del comercio pueden mejorarse en América Latina

2 = Mejor desempeño

Nota: Disponibilidad de la información y uso de consultas públicas es la media de los indicadores de la facilitación del comercio (TFI, por sus siglas en inglés) A y B. Eficiencia del marco jurídico es la media de los indicadores TFI C y D. Simplicidad de los procedimientos es la media de los indicadores TFI F, G y H. Eficacia de las agencias fronterizas es la media de los indicadores TFI I, J y K. ALC-7 es la media de Argentina, Brasil, Chile, Colombia, Costa Rica, México y Perú.
Fuente: Estadísticas sobre los Indicadores de Facilitación del Comercio de la OCDE (TFI, por sus siglas en inglés).

La facilitación del comercio debe ir acompañada de reformas más amplias que fomenten la productividad. Impulsar la competitividad de las exportaciones y la productividad empresarial también requiere un entorno empresarial más dinámico, una mayor competencia doméstica, un mejor acceso a la financiación, más capacitación y capacidad de innovación. Estas reformas se refuerzan mutuamente: las empresas más productivas tienen mayor probabilidad de exportar, invertir y formalizarse.

El fortalecimiento de la integración regional sigue siendo relevante en América Latina, especialmente en un mundo donde las cadenas de valor están cambiando y los centros regionales cobran mayor importancia. El enfoque debe centrarse en la cooperación: mejorar la cooperación entre organismos fronterizos, el reconocimiento mutuo de normas, el intercambio de datos, los sistemas interoperables y el reconocimiento de estándares técnicos comunes. La región también cuenta con un potencial sin explotar en el comercio de servicios, gracias a idiomas compartidos y husos horarios similares; sin embargo, el comercio interregional de servicios sigue siendo bajo en comparación con los estándares mundiales.

América Latina debe adoptar una visión más orientada hacia el exterior. Acuerdos comerciales como el de la UE-Mercosur, y la participación en marcos plurilaterales como la Alianza del Pacífico o el CPTPP pueden ayudar a diversificar mercados de exportación, atraer inversión, fortalecer la participación en las cadenas globales de valor y aprovechar nuevas tecnologías. Sin embargo, para aprovechar al máximo los beneficios de estas iniciativas, los países deben mejorar su capacidad de implementación y garantizar la coherencia entre las políticas comerciales, de inversión y regulatorias.

América Latina cuenta con ventajas reales: vastas reservas de minerales críticos, abundante energía renovable, una fuerza laboral joven y cada vez más cualificada, y proximidad a mercados clave. Al impulsar reformas concretas que mejoren la competitividad, reduzcan las barreras comerciales y atraigan inversión de calidad, la región puede convertir los desafíos actuales en oportunidades y sentar las bases para un crecimiento más sólido y resiliente.

Referencias:

OECD (2025), OECD Economic Outlook, Volume 2025 Issue 1, OECD Publishing, Paris, doi – Reporte completo en inglés con las proyecciones macroeconómicas, los principales desafíos estructurales e información detallada por país.

Perspectivas económicas de la OCDE para países de América Latina, Junio 2025.

Información detallada por país: Argentina Brasil Chile Colombia Costa Rica | México Perú


Improving education and skills in Czechia

By Federica De Pace, OECD

Czechs, young and old, possess solid skills. Since 2012, 15-year-olds have consistently outperformed the OECD average across all subjects in the Programme for International Student Assessment (PISA). Adult skills, measured by the 2023 OECD Survey of Adult Skills, are broadly in line with the OECD average, but numeracy stands out as a particular strength. Yet, averages hide important inequalities in educational outcomes, with disadvantaged students falling further behind their advantaged peers than in most other OECD countries (Figure 1). In addition, high educational mismatches suggest that the education system does not always provide students with the right skills (Figure 2).

With skill shortages already biting, expanding the skilled workforce is vital for sustaining growth. Demographic decline, digitalisation, and the green transition will only heighten the pressure. Against this background, the 2025 Economic Survey of Czechia explores ways to enhance equality of opportunities and the quality of education for all students, and ensure that workers can upskill and reskill throughout their careers.

Expanding capacity and participation to high-quality affordable early childhood education and care will be paramount to improve educational outcomes of the most vulnerable, besides facilitating mothers’ participation in the labour market. Directing support to schools with a high proportion of disadvantaged students as well as better diagnostics to reduce Roma overrepresentation in special schools are also key to tackling educational inequality. Meanwhile, Czechia’s early school tracking disadvantages talented students lacking strong family support. Delaying tracking and narrowing quality gaps between general and vocational education would help Czechia make the most of its talent.

Strengthening the teaching workforce and improving the efficiency of the school network are essential for enhancing the quality of education. However, limited career prospects and challenging working conditions make it difficult for Czechia to attract and retain qualified teachers, with adverse effects on educational outcomes. Teacher shortages have worsened, particularly in scientific subjects and in both remote regions and Prague. The problem is exacerbated by an abundance of small schools, a consequence of a highly decentralised education system and administrative fragmentation. Enhancing working conditions—notably by diversifying career pathways—could help draw and retain talent. At the same time, consolidating the school network, by setting minimum school sizes to encourage mergers and cooperation, would allow resources to be redirected from administration to teaching.

Reforms are needed to better align skills with labour market demands. The vocational education and training (VET) system often falls short of equipping students for the workplace, partly due to limited exposure to work-based learning—only 16% of VET students participate, compared to an EU average of 64.5%. Reducing over-specialisation and expanding work-based learning, for example by tying VET school funding to student participation in work placements and strengthening the role of social partners in shaping curricula and delivering training, could help bridge this gap. Meanwhile, adult learning participation should be expanded, particularly for low-skilled workers. Offering flexible, modular learning options—where long programmes are broken into self-contained units, each with its own learning outcomes and qualifications (micro-credentials)—would make upskilling more accessible.

Tertiary attainment must also rise to meet growing demand for highly skilled graduates, particularly in technical fields such as civil engineering, ICT, and the natural sciences. In 2022, just 34.6% of young adults held a tertiary degree, well below the OECD average of 47.4%. Expanding access and improving completion rates—including through grants and loans for students from vulnerable backgrounds—would help ensure a better match between skill supply and labour market needs.

References

OECD (2025), OECD Economic Surveys: Czechia 2025, OECD Publishing, Paris, https://www.oecd.org/en/publications/oecd-economic-surveys-czech-republic_19990561.html


Ukraine’s narrow path to debt sustainability

A lighthouse along the coast in Ukraine

By Volker Ziemann, OECD

Public debt is rising rapidly

While the economy has shown remarkable resilience, soaring defence expenditures of over 25% of GDP annually and weaker revenues have put the fiscal position under significant strain. Ukraine’s public debt is rising sharply, surging from less than 50% as a share of GDP in 2021 to almost 90% of GDP in 2024 and will most likely exceed 100% of GDP in 2025 and the coming years. As of end-2024, concessional financing constitutes nearly 60% of outstanding debt​. Although these favourable terms have helped contain immediate risks, the debt trajectory remains precarious, requiring sustained and bold policy action.

Building stronger fiscal foundations

Achieving fiscal sustainability will require Ukraine to implement a mix of targeted revenue reforms, improve public investment management and better coordinate across levels of government, as discussed in the 2025 OECD Economic Survey of Ukraine. Recent amendments to the Budget Code present an opportunity to embed medium-term planning and project prioritisation into the budget process, a vital step for aligning spending with strategic goals. On the revenue side, narrowing the scope of the presumptive tax regime and limiting VAT exemptions can strengthen the tax base, while simplifying compliance within the standard tax regime can reduce burdens for businesses.

At the same time, procurement reforms are needed to ensure that public contracts are awarded based on value for money rather than cost alone. Strengthening subnational governments’ role in service delivery, supported by financing tools that encourage municipal cooperation, can further improve efficiency and accountability. If fully implemented, these fiscal measures would support Ukraine’s medium-term objective of returning to a primary surplus and reducing reliance on debt-financed spending.

Concessional external financing has been and will remain critical. Following the full-scale invasion, international partners rapidly stepped in, providing grants, loans, and in-kind support that funded Ukraine’s widening deficits​. However, shifting geopolitical priorities could threaten this support. Ensuring transparency, demonstrating reform momentum, and maintaining strong governance will be vital to keep international supporters engaged.

Economic growth will underpin debt sustainability

Following the Global Financial Crisis, Ukraine’s growth lagged behind that of peer countries, widening the per capita GDP gap by almost 20 percentage points between 2008 and 2021. The war has added another five percentage points to this gap.

Long-term growth will be a key determinant of Ukraine’s debt sustainability. The 2025 OECD Economic Survey of Ukraine presents alternative growth scenarios through 2050, showing that reform implementation, demographic trends, and investment patterns will critically shape Ukraine’s output trajectory. In all scenarios, growth initially rebounds as displaced populations return and reconstruction accelerates. However, weak demographic dynamics, particularly an ageing and shrinking workforce, begin to weigh on growth in later years.

In the baseline reform scenario, GDP per capita grows by 2.6% annually, reducing the per capita gap to peer countries by six percentage points by 2050. With accelerated reforms, the growth rate increases to 3.6% per year over the next 25 years, comparable to the post-1995 growth in countries like Poland and Slovakia during EU accession. In this scenario, the per capita GDP gap to peer countries would shrink by 14 percentage points by 2050. In contrast, under a policy slippage scenario, growth settles at only 1.3% per year, not allowing any catch-up with peer countries.

These scenarios highlight the payoff of reforms outlined in the 2025 OECD Economic Survey of Ukraine. A stronger rule of law, higher employment, and sustained investment would enable faster growth and support public finances. Without them, demographic headwinds and weak capital formation could limit Ukraine’s long-term potential and complicate debt management.

High uncertainty surrounds the future path of public debt

Accordingly, Ukraine’s ability to achieve public debt sustainability ultimately rests on three interdependent pillars: stronger economic recovery, credible fiscal discipline, and continued concessional external support. The 2025 OECD Economic Survey of Ukraine outlines alternative public debt scenarios depending on the respective fiscal and growth assumptions. In the most favourable case, where Ukraine meets its primary surplus targets, reinforces the reform momentum, and continues to access concessional financing, debt could steadily decline to around 80% of GDP by 2050 (including G7-provided Extraordinary Revenue Acceleration loans, which carry no repayment obligations under current conditions).

In contrast, under the baseline reform scenario with continued implementation of current reform plans, debt stabilises in the medium term but remains above 100% of GDP and rises over the longer term as weak demographics weigh on growth and concessional financing declines. In the downside scenario, where reforms stall, concessional finance dries up, and the primary budget is broadly balanced, public debt surpasses 140% of GDP by 2035.

Conclusion

Ukraine’s path to sustainable public debt is narrow and conditional. It will require a combination of robust economic growth, accelerated reform implementation, strategic fiscal consolidation, and steady concessional external financing support. Getting on this path is critical to securing Ukraine’s recovery and safeguarding its economic future.

For more information, visit the Ukraine snapshot page.

References

OECD (2025), OECD Economic Surveys: Ukraine 2025, OECD Publishing, Paris, https://doi.org/10.1787/940cee85-en


Boosting efforts to improve health in Estonia

Picture of a woman putting together a puzzle of an outline of a human head, with one piece missing

By Srdan Tatomir, OECD

This week is European Mental Health Awareness week, which aims to raise understanding of mental health. In Estonia, mental health problems are significant. Adult suicide rates are high and above most OECD countries (Figure 1). The first Estonian National Mental Health Survey in 2022 found that a quarter of adults was at risk of anxiety and depression. Lower income groups, particularly men, were more likely to be affected (OECD, 2024). Among adolescent children, almost 30% report feeling depressed every week, and this has risen over time (TAI, 2025). Ill mental health carries a high human toll and is estimated to cost Estonia 2.8% of GDP each year (OECD, 2021).

Estonia has recognised this and expanded its efforts to improve mental health. The 2021 Green Paper on Mental Health developed the foundations and is being implemented through the Mental Health Action Plan for 2023-26. A new mental health department has been established within the Ministry of Social Affairs and funding for mental healthcare services has more than tripled to EUR 7 million in 2023. New surveys to monitor and better understand the issues have been put in place. This year, Estonia adopted its first Suicide Prevention Action Plan for 2025–2028.

These policies aim to create a comprehensive, intersectoral and multi-level mental health system and broaden access to both community-based and specialist healthcare services.

Better health of Estonia’s people, highlighted by the OECD’s 2024 Economic Survey, can be achieved in other areas as well. Life expectancy at birth has risen by around 8 years over the past two decades to 78.8 years by 2023. This is higher than in neighbouring Baltic countries but below most European and OECD countries. Around a third of the deaths can be avoided through faster treatment and more prevention. For example, with more than half of adults obese, physical activity levels need to increase and nutrition could be healthier. To address this, Estonia should introduce a tax on sugar-sweetened beverages and could tax unhealthy foods more broadly as done in Hungary.

Furthermore, alcohol consumption is among the highest in the OECD. Reducing affordability by raising alcohol excise duties and linking them to inflation as well as reducing availability through restricting opening hours and density of alcohol sales outlets can help lower consumption. To maximise their effectiveness, policies on alcohol need to be coordinated with other Baltic countries.

The number of healthcare staff, crucial to improving health outcomes, should increase. The number of health workers relative to the population is low compared to other OECD countries. In 2022, there were 6.6 practising nurses per 1 000 people, well below most OECD and EU countries. The ratio of practising doctors was 3.5 per
1 000 people, slightly below the OECD average and lower than in most EU countries. More nurses, school and clinical psychologists, and psychiatrists are needed in particular to deliver more mental health services (Sisask, 2023). Given that the workforce is ageing quickly, raising nurse and doctor training levels is paramount. This should be complemented by better remuneration and working conditions to make the healthcare profession more attractive, as discussed in the 2024 OECD Economic Survey of Estonia.

Estonia’s total spending on healthcare is among the lowest in the OECD (Figure 2). Population ageing is driving up demand for more healthcare and new services will ultimately require additional resources. Better use of technology, improved administration and enhanced financial incentives can free up more resources. This year’s increase in user charges for specialised care is a step in the right direction as it will help both raise revenues and lead to more efficient use of specialist services. Nevertheless, more revenues will be needed to fund public healthcare services and to ensure out-of-pocket spending does not cause financial difficulties for vulnerable households.

Better healthcare will improve the quality of life in Estonia, allow people to stay active longer and contribute to a stronger economy with higher tax revenues.

For further information, please visit the Estonia Economic Snapshot page.

Learn more about Mental Health Awareness Week.

References

OECD (2021), A New Benchmark for Mental Health Systems: Tackling the social and economic costs of mental ill-health, OECD Health Policy Studies, OECD Publishing, Paris; https://doi.org/10.1787/4ed890f6-en.

OECD (2024), OECD Economic Surveys: Estonia 2024, OECD Publishing, Paris; https://doi.org/10.1787/33e6beee-en.

Sisask, M. (ed.) (2023), Estonian Human Development Report 2023: Mental Health and Well-Being, Estonian Cooperation Assembly, Tallinn.

TAI (2025), Andmebaas – Health Statistics and Research Database, accessed on 28 April, 2025.