A new aggregate measure of human capital: Linking education policies to productivity through PISA and PIAAC scores

By Balázs Égert, Christine de la Maisonneuve and David Turner, OECD Economics Department.

While human capital is widely regarded as a key driver of economic growth, measuring it is challenging. The empirical literature aimed at constructing a measure of human capital at the country level has combined quantity (such as mean years of schooling) and quality (typically internationally standardised test scores) components either using arbitrary, most often equal, weights or by including them separately in estimations. Results tend to show, surprisingly, that one component is dominant and the other completely insignificant. A further weakness of many studies that try to incorporate notions of quality into measures of the human capital stock is that they are based on contemporaneous flow measures that most often relate to students tested at age 15, which are unlikely to be representative of the skills of the entire (and older) working age population.

Our recently published working paper: A new macroeconomic measure of human capital exploiting PISA and PIAAC: Linking education policies to productivity (Égert et al, 2022) addresses these two weaknesses by constructing a new stock measure of human capital that makes use of OECD data from the Programme for International Student Assessment (PISA) and the Programme for the International Assessment of Adult Competencies (PIAAC). Improving aggregate measures of human capital is important given the central role that education, training and skills play as a driver of economic performance.

A new aggregate stock measure of human capital

The new measure is a cohort-weighted average of past PISA scores (representing the quality of education) of the working age population and the corresponding mean years of schooling (representing the quantity of education). Contrary to the existing literature, the relative weights of the quality and quantity components are not imposed or calibrated but are estimated directly. Our calculations involve three stages.

  • First, a matching is established between PIAAC adult test scores, mean years of schooling and PISA student test scores of the corresponding cohort who took the student tests as 15-year olds. Such matching is reasonable given that both PIAAC and PISA tests capture similar skills: PISA scores cover reading, maths and science; PIAAC adult test scores cover literacy, numeracy and problem solving.
  • Second, PIAAC test scores are regressed on matched PISA test scores and mean years of schooling. The estimation results show that the elasticity of the stock of human capital with respect to the quality of education is three to four times larger than for the quantity of education.
  • Third, these estimated elasticities are used to construct an aggregate time series stock measure of human capital by cumulating quantity and quality measures across all cohorts in the working age population.

This approach relies on combining data from both PISA and PIAAC in order to overcome inherent problems with using either in isolation. On the one hand, PIAAC provides a measure of skills for the entire adult working age population, but has no time series and limited country coverage, hence ill-suited for empirical regression analysis. On the other hand, PISA only applies to those aged 15 but, very importantly, especially when combined with similar international test scores, has a more extensive time series and country coverage.

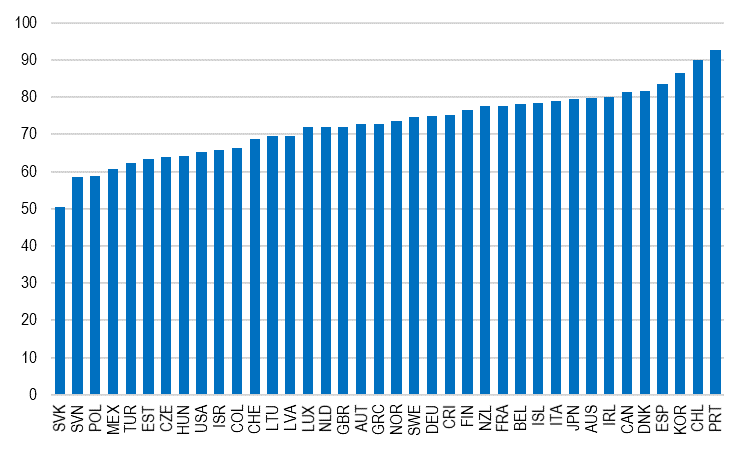
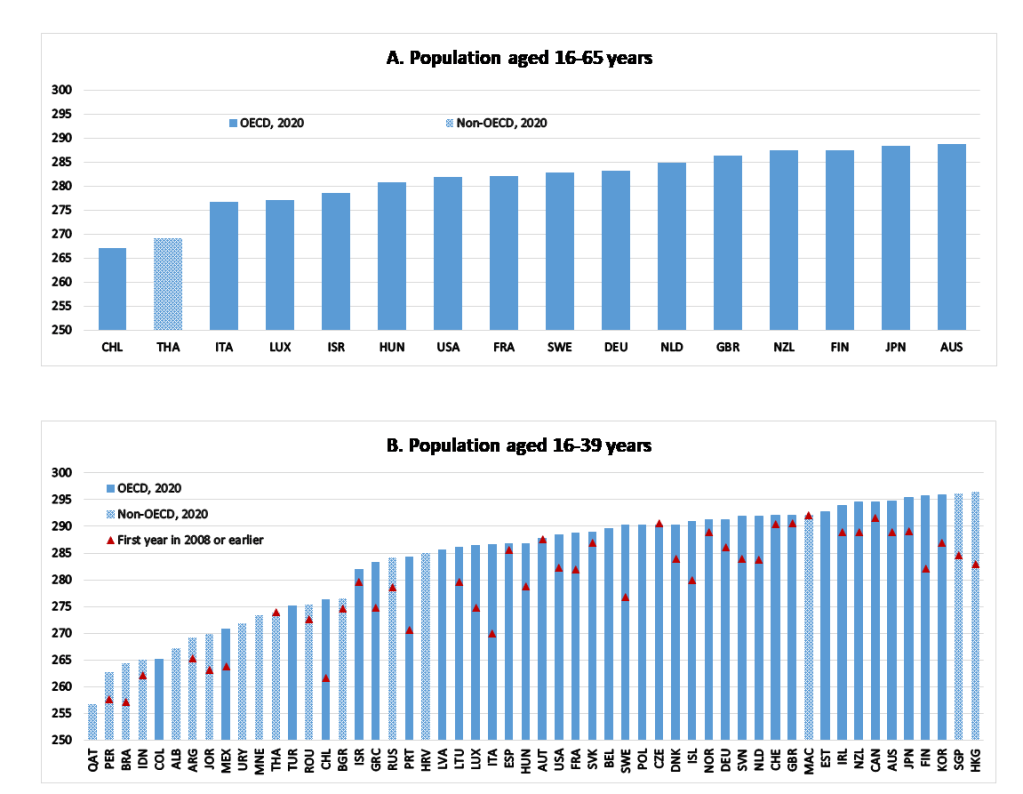
The new measure of human capital for the population aged 16 to 65 years suggests that the countries with the greatest human capital include Australia, Japan and Finland, while Chile and Thailand have the lowest levels of human capital among this group of 16 countries (Figure 1, Panel A).1 These rankings for the last available year are broadly confirmed for the stock covering the population aged 16-39 (Figure 1, Panel B), although there are some differences suggesting that younger generations have been increasingly better educated in some countries than in others. For instance, Finland lags behind Japan for the total stock, but the countries flip places for the stock covering only the younger generations, because the stock of human capital of younger generations has risen more strongly in Finland compared to Japan.

Figure 1. The new measure of the stock of human capital

Note: The stock of human capital is calculated as the cohort-weighted average of student test scores adjusted for the coefficient estimates linking PIAAC adult test scores to PISA student test scores (log-log specification with country fixed effects, transformed from log to levels). The first years in panel B range from 1987 to 2008.

Human capital effects on productivity are potentially large but come with long lags

The new measure of human capital shows a robust positive correlation with productivity for OECD countries in cross-country time-series panel regressions, suggesting that improvements in human capital are accompanied by macroeconomic productivity gains.

Simulations suggest that the potential for long-run productivity gains is much greater from improvements in the quality than the quantity component of human capital. An improvement in PISA test scores, equivalent to closing the gap between the median and the top three performing OECD countries, eventually generates a long-run increase in multi-factor productivity (MFP) of between 3.4% and 4.1%. Alternatively, a similar increase in mean years of schooling, also corresponding to reducing the gap between the median and the top three performing OECD countries, generates an increase in TFP of between 1.8% and 2.2%.

Another finding is that gains in productivity through the human capital channel can be of the same order of magnitude as from improving product market regulation, again using the same benchmark of closing the gap between the median and the top three performing OECD countries. The lags are, however, also typically much longer from the human capital channel, particularly because it takes almost five decades before a sustained improvement in student skills are fully reflected in improvements in the skills of the entire working age population (Figure 2). These long lags can be shortened by putting more emphasis on adult learning including life-long learning and upskilling of the existing workforce, improving human capital at older ages.

Figure 2. Comparing policy responses to improve skills and product market competition

Change in multi-factor productivity, per cent

Note: The chart displays the dynamic response of MFP to a standardised shock to student skills and product market regulation. The shocks are standardised by calibrating the magnitude of the shock as the difference between the OECD median country and the top three performing countries in terms of the shocked indicator. The shock to human capital assumes that skills are upgraded gradually as students enter the workforce.

Assessing the effect of education policy reforms on human capital and productivity: the illustrative example of pre-primary education

An attractive feature of the new stock measure of human capital is that it opens up new avenues for evaluating the effect of education policy reforms on productivity and per capita income. Any education policy, which can be measured quantitatively through an indicator and linked to changes in student test scores, can be related to the new measure of human capital and so to productivity.

We use pre-primary education as an illustrative example. The first step in the quantification of the effect of pre-primary education attendance may be provided by the existing empirical literature using microeconomic student-level data, which finds that students previously enrolled in pre-school for more than one year perform better in student skill tests, improving their test scores by between 8.2 and 9.6 points. This corresponds to an increase of 1.7% to 1.9% compared to the OECD median PISA score in 2018.

In order to assess the policy effects on the stock of human capital and multi-factor productivity from reforming pre-primary education, two scenarios are considered: i.) closing the gap between the lowest level of pre-primary attendance observed in the OECD (9% in Turkey) and the average of the top three performers (84%, Spain, France and New Zealand), and ii.) closing the gap between the median OECD country (72%, Austria) and the average of the top three performers. Results indicate that a sustained effort to increase attendance in pre-primary education boosts productivity in the long run between 0.9% and 2.2% for the first scenario, and gives rise to a more limited increase of 0.1% to 0.3% in the second scenario.

Future work will focus on a systematic evaluation of a wide range of education policies on the new measure of human capital and macroeconomic outcomes as well as considering how adult training policies impact on human capital.

Reference

Égert, B., C. de la Maisonneuve and D. Turner (2022), “A new macroeconomic measure of human capital exploiting PISA and PIAAC: Linking education policies to productivity”, OECD Economics Department Working Papers, No. 1709, OECD Publishing, Paris, https://doi.org/10.1787/a1046e2e-en.


[1] There are a limited number of countries with a sufficiently long time series of student test scores to be able to construct the measure for the full working age population. This implies a trade-off. A comprehensive measure covering the entire working age population can only be computed for 15 OECD countries. A measure covering those aged 16 to 39 is available for a total of 54 OECD and non-OECD countries in the last available year, and 12 countries have data series for more than 20 years and an additional 27 countries are covered for about a decade.


How can independent fiscal institutions support the resilience of public finances?

By Scott Cameron, Stéphane Jacobzone and Lisa von Trapp (OECD Directorate for Public Governance); Jörg Haas, Łukasz Rawdanowicz and Sébastien Turban (OECD Economics Department).

Public finances will face significant challenges after the Covid-19 crisis and due to the consequences of the Russian invasion of Ukraine. Government debt has reached the highest levels in decades, albeit interest payments are at historical lows. Population ageing and climate change will weigh on government budgets. Fiscal policy may also need to provide more macroeconomic stabilisation if monetary policy remains constrained by low interest rates.

While providing adequate responses to these challenges, governments will confront political economy biases. These biases have contributed in the past to higher deficits, a tendency towards short-termism (e.g. by cutting public investment disproportionately after the Global Financial Crisis (GFC)), and a procyclical fiscal policy stance.

In this blog post, building on our recent paper: Constraints and demands on public finances: Considerations of resilient fiscal policy (Rawdanowicz et al., 2021), we discuss how credible and transparent fiscal frameworks can contribute to sustainable fiscal policies by minimising those biases. In particular, we focus on independent fiscal institutions (IFIs), reviewing their increasing popularity and taking stock of recent country experiences.

What are IFIs?

IFIs are public institutions with a mandate to critically assess and, in some cases, provide non‑partisan advice on fiscal policy and performance (von Trapp, Lienert and Wehner, 2016). Examples include the Congressional Budget Office in the United States, the Bureau for Economic Policy Analysis (or CPB) in the Netherlands, the Office for Budget Responsibility in the United Kingdom and Spain’s Independent Authority for Fiscal Responsibility.

In contrast to audit institutions, their assessments are forward-looking (Kopits, 2011) and unlike independent central banks, they do not have the authority to make policy. Rather, they ensure that unbiased information about the government’s fiscal policies and their consequences is available. This additional transparency enhances the quality of the political debate, making governments more accountable for their policy choices and more credible vis‑à‑vis citizens and financial markets. IFIs thus support the sustainability of public finances.

In most countries, IFIs were established after the GFC, though in a few they have existed for more than 50 years (Table 1). The main motivations for establishing IFIs were improving the transparency of the budgetary process and monitoring compliance with fiscal rules in the context of high debt.

Table 1. Most independent fiscal institutions are young

Timing of foundation

Note: Norway’s Advisory Committee for Fiscal Policy Analysis has recently had its mandate extended to independently assess the sustainability of fiscal policy, bringing it closer to some European IFIs. The Norwegian ministry of finance acts as its secretariat and one committee member is employed by the ministry, though this member is not involved in assessing the sustainability of fiscal policy.
Source: OECD Independent Fiscal Institutions Database 2021; OECD Secretariat.

IFIs are common but their functions differ

Today, there are IFIs in three out of four OECD economies, although they vary widely with regard to their mandate and resources (Figure 1). A new OECD dataset (OECD, 2021a) shows that typical tasks of IFIs include assessing long-term fiscal sustainability, endorsing or producing economic and fiscal forecasts, monitoring compliance with rules, and estimating costings of policies. IFIs with more demanding mandates, particularly those involved in cost estimations, tend to have more staff at their disposal, for example in Korea, the Netherlands and the United States. By contrast, IFIs in some of the largest OECD economies, such as Germany and France, have limited mandates and relatively few staff.

Figure 1. Mandates and resources of IFIs vary widely across the OECD countries

Note: Several OECD countries have chosen to have their official macroeconomic forecasts supplied by an independent organisation other than an IFI, for example, Austria (the Austrian Institute of Economic Research), Finland (an independent body within the Ministry of Finance), Luxembourg (STATEC, the national statistics advisor), Slovenia (the Institute of Macroeconomic Analysis and Development), and Sweden (the National Institute of Economic Research). Canada takes its macroeconomic assumptions from an average of private-sector forecasts.
Source: OECD Independent Fiscal Institutions Database 2021.

IFIs contribute to fiscal stability but they do not guarantee it

While research has tentatively associated IFIs with increased fiscal rule compliance, more accurate forecasts (Fall et al., 2015; Beetsma et al., 2018), and less pro-cyclical fiscal policy (Debrun and Kinda, 2017), they are neither a necessary nor a sufficient condition for sustainable public finances. Some countries with a reputation for fiscal prudence and transparency have a small fiscal council with a very limited mandate, like Sweden, or none, like New Zealand. IFIs may not need to be strong to maintain compliance with fiscal rules if there is a political consensus in favour of low deficits. Conversely, even an IFI with a far-reaching mandate will not be able to keep a government from circumventing fiscal rules that are not supported by the electorate. The interaction between the elements of a fiscal framework plays a key role.

Still, there are numerous examples of how IFIs can contribute to fiscal performance across various areas:

  • Assessing long-term fiscal sustainability. The Canadian Parliamentary Budget Officer produces an annual fiscal sustainability report covering all levels of government and public pension plans. The analysis has been used to challenge official narratives in several high-profile policy debates on changes to the age of eligibility for elderly benefits and adjustments to subnational transfer programmes for health care (Parliamentary Budget Office of Canada, 2021).
  • Endorsing or producing economic and fiscal forecasts. Italy’s Parliamentary Budget Office is mandated with endorsing the budget’s macroeconomic assumptions under domestic legislation to meet requirements of the EU’s fiscal surveillance framework. In 2016, the Italian IFI determined that the government’s forecast was optimistic and declined to endorse it. Following a parliamentary hearing, the government revised its plans using more conservative assumptions (Ufficio parlamentare di bilancio, 2019).
  • Monitoring compliance with rules. The Irish Fiscal Advisory Council is required to confirm the government’s compliance with the domestic implementation of the EU fiscal rules. To do so, it developed innovative methods to estimate Irish potential GDP and the output gap, which are notoriously volatile in Ireland under the EU’s commonly agreed methodology, owing to distortions from capital flows and activity related to foreign-owned multinational enterprises (OECD, 2021b).
  • Costing of policies. The US Congressional Budget Office played a pivotal role in informing debate on the multi‑trillion dollar Coronavirus Aid, Relief and Economic Security (CARES) Act. It published a preliminary costing of the Act and responded to subsequent requests from Congress to evaluate other aspects of the economic impact of the Act (OECD, 2020). In the Netherlands, the CPB assesses the fiscal and economic effects of parties’ election platforms and the coalition agreements after the elections. These analyses have raised awareness of the need, at a political level, for prudent and sustainable budget policies (von Trapp, Lienert and Wehner, 2016).

IFIs during the pandemic

For IFIs established following the GFC, the COVID-19 pandemic was their first major test. As traditional channels of parliamentary oversight faced operational constraints and emergency legislative protocols, IFIs stepped in to provide independent scrutiny of emergency spending programmes and real-time forecasts of the rapidly evolving economy and public finances (OECD, 2020). Over 90% of national IFIs in the OECD published rapid analyses of the economic and budgetary impact of the pandemic (see Figure 2 for a breakdown). They were an important source of analysis, with government either focused on fast responses or reluctant to publish analysis given the high degree of uncertainty. IFIs thus contributed to an open and democratic debate about public finance issues. They also supported governments activating escape clauses to suspend fiscal rules to ensure much-needed support to households and businesses through a transitory and unprecedented stress. The crisis showed that IFIs’ varied mandates allowed them to respond in a meaningful way and to influence public debate. IFIs will continue to be critical partners during recovery as governments seek to restore sustainable and resilient public finances.

Figure 2. Breakdown of rapid analyses by IFIs during the Covid-19 pandemic

Number of IFIs

Note: The dataset includes 40 IFIs, covering institutions within the OECD (including two sub-national IFIs and one independent advisory body established at the European level) and Brazil.
Source: OECD (2020).

References

Beetsma, R. et al. (2018), “Independent Fiscal Councils: Recent Trends and Performance”, IMF Working Papers, No. 68, International Monetary Fund, https://www.imf.org/en/Publications/WP/Issues/2018/03/23/Independent-Fiscal-Councils-Recent-Trends-and-Performance-45726.

Debrun, X. and T. Kinda (2017), “Strengthening Post-Crisis Fiscal Credibility: Fiscal Councils on the Rise – A New Dataset”, Fiscal Studies, Vol. 38/4, pp. 667-700, https://doi.org/10.1111/1475-5890.12130.

Fall, F. et al. (2015), “Prudent debt targets and fiscal frameworks”, OECD Economic Policy Papers, No. 15, OECD Publishing, Paris, https://dx.doi.org/10.1787/5jrxtjmmt9f7-en.                

Kopits, G. (2011), “Independent Fiscal Institutions: Developing Good Practices”, OECD Journal on Budgeting, https://dx.doi.org/10.1787/budget-11-5kg3pdgcpn42.

OECD (2021a), OECD Independent Fiscal Institutions Database, Version 2.0, https://www.oecd.org/gov/budgeting/ifi-database.htm (accessed on  January 2021).

OECD (2021b), Statement on a Two-Pillar Solution to Address the Tax Challenges Arising From the Digitalisation of the Economy, https://www.oecd.org/tax/beps/statement-on-a-two-pillar-solution-to-address-the-tax-challenges-arising-from-the-digitalisation-of-the-economy-july-2021.pdf.

OECD (2020), “Independent Fiscal Institutions: Promoting Fiscal Transparency and Accountability during the Coronavirus Covid-19 Pandemic”, https://doi.org/10.1787/d853f8be-en

Parliamentary Budget Office of Canada (2021), Fiscal Sustainability Report, https://www.pbo-dpb.gc.ca/en/blog/news/RP-2122-010-S–fiscal-sustainability-report-2021–rapport-viabilite-financiere-2021.

Rawdanowicz, Ł. et al. (2021), “Constraints and demands on public finances: Considerations of resilient fiscal policy”, OECD Economics Department Working Papers, No. 1694, OECD Publishing, Paris, https://dx.doi.org/10.1787/602500be-en.

Ufficio parlamentare di bilancio (2019), 2019 Budgetary Policy Report, https://www.euifis.eu/download/pbo_2019_budgetary_policy_report_web.pdf

von Trapp, L., I. Lienert and J. Wehner (2016), “Principles for independent fiscal institutions and case studies”, OECD Journal on Budgeting, https://dx.doi.org/10.1787/budget-15-5jm2795tv625.


What explains the striking differences in vaccination uptake across OECD countries?

By David Turner, Nicolas Woloszko, Thomas Chalaux and Marnix Dek, OECD Economics Department

Massive differences in COVID-19 vaccination coverage between rich and poor countries are mostly explained by supply and logistical issues. However, even among OECD countries, where such issues are no longer a major constraint, there remain striking differences in the share of the population that is fully vaccinated (Figure 1). Our recently published OECD Working Paper: Understanding differences in vaccination uptake among OECD countries (Turner, D., et al., 2022) attempts to understand the reasons for these differences, which is important not only in dealing with current and future waves of COVID-19, but also to be better prepared for the next pandemic.

Figure 1. The share of the population fully vaccinated in OECD countries

Per cent, data for the 11th of March or nearest period.

Note: Total number of people who received full doses prescribed by the initial vaccine protocol divided by the total population of the country. Alternative definitions of vaccination, for example having been infected or having one dose of a two doses protocol, are ignored in order to maximise cross-country comparability.
Source: Our World in Data, downloaded on the 11th of March 2022.

Vaccinations have major health and economic benefits. There is overwhelming evidence from extensive clinical trials and real world experience that vaccines provide protection against the most severe outcomes of COVID-19. There is also clear evidence that OECD countries with less extensive vaccine coverage have experienced more COVID-related deaths from the most recent wave of the Omicron variant. Analysis by Oliu-Barton, Pradelski, Woloszko et al. (2021) suggests that an increase of vaccination by 10 percentage points is associated with an increase of ½ of a percentage point in GDP after four weeks.

The time profile of vaccination rates typically follows an S-shaped logistic curve, which captures the main dynamics of a diffusion process: adoption is initially slow due to supply constraints and widespread hesitancy, then peaks when logistical problems are solved, until coverage starts plateauing as progress depends on persuading those that are reluctant or hard to reach. As a result, the drivers of vaccine uptake in the early stages of the vaccination campaigns are no longer the main explanations of current vaccination levels:

  • Supply constraints were initially bottlenecks, but have since been overcome. By the end of April 2021, Israel, Chile, the United States, the United Kingdom and Hungary were far ahead of other OECD countries in terms of number of vaccine doses delivered. However, most other OECD countries have since caught up and among these five early leaders, only Chile remains in the highest quartile of vaccine coverage among OECD countries.
  • Initial vaccine hesitancy can be overcome. Among a small sample of OECD countries for which survey evidence is regularly available, there is little correlation between the share of the population that is currently not fully vaccinated and the share of a surveyed population who was unwilling or uncertain to consider vaccination at the beginning of 2021.

The focus on the contemporaneous rates of vaccination precludes using time series statistical methods, and the paper thus highlights some of the key drivers of vaccination based on univariate correlations:

  • Many of the countries where flu vaccination has been historically low are also those where current vaccine coverage against COVID is low. Similarly, there is a positive correlation between the share of general practitioners likely to prescribe vaccines against other illnesses and current vaccine coverage against COVID.
  • Trust in healthcare systems is correlated with vaccination in the small number of countries where it is surveyed regularly. For a wider sample of countries, there appears to be a weaker correlation with an indicator of access to and quality of healthcare.
  • Demographics factors:
    • The elderly are more vulnerable to COVID and have higher vaccination rates. As a result, countries that have a high elderly population share tend to have a higher overall vaccination rate, as evidenced by Japan (with relatively high shares of both), compared to Turkey, Colombia and Mexico (relatively low shares).
    • There seems to be major differences across countries in the tendency to vaccinate children, which help to explain differences in total population vaccine coverage. Vaccine coverage of children aged 0 to 17 is particularly low (often around 10% or less) in Eastern European countries, Mexico and Turkey as opposed to Denmark and Portugal where it is much higher (more than 40%).
  • There is no simple correlation of vaccine coverage with survey measures of trust in government, but it does appear that low trust in government implies greater vulnerability to mixed messages from other sources. Many of the OECD countries with the lowest vaccination rates have both a low trust in government and a greater reliance on social media for news and information. Also, when the merits of vaccination are disputed by mainstream political parties, then vaccination rates can be correlated with political affiliation.

While a substantial share of the differences in vaccination rates across countries depends on pre-existing factors, vaccine policies also play an important role and contribute to explain differences in vaccination rates:

  • Nudge policies (e.g., lotteries, financial incentives, public health messages) are found by a number of studies based on Randomised Controlled Trials to have accelerated vaccination in the early phases, but to have had non-significant effects afterwards (Chang et al., 2021), or even a negative effect on some subgroups due to a backlash effect. 
  • COVID certificates had a substantial impact in some countries. For instance, Oliu-Barton, Pradelski, Woloszko et al. (2021) estimate that they boosted vaccination by 13 percentage points in France, 6 percentage points in Germany, and 10 percentage points in Italy. This is consistent with simple time series evidence from a number of countries as new vaccinations seem to have substantially increased following the COVID certificate announcements in Germany, Finland, France, Italy, Mexico and Slovenia (Figure 2). However, their effect was less clear in countries where the coverage of COVID certificates was narrower, such as in Poland, Spain and Sweden where they were limited to restricting international travel.
  • Vaccine mandates were set up for selected professions (including healthcare workers and civil servants) in most OECD countries. Greece and Italy made vaccination mandatory for the elderly, resulting in substantial increases in vaccination rates for these segments of the population. The announcement of the vaccine mandate for the general population in Austria was found to boost vaccination by 3 percentage points in November 2021 (Kloiber, Peichl and Winner, 2021), but was suspended on 9 March 2022.

Figure 2. Daily number of people receiving their first vaccine dose per 100

Seven-day moving average, date of the COVID certificate announcement = 0

Note: The horizontal axis measures the days relative to the date of a COVID certificate announcement; the vertical axis shows the number of new people vaccinated per hundred population as an index based the day of the announcement. 
Source: Our World in Data, downloaded on the 11th of March 2022; Oliu-Barton, Pradelski, Woloszko et al. (2021).

Vaccination dramatically reduced the human and economic toll of the COVID-19 pandemic. The lower levels of uptake in some OECD countries remain an important issue, especially if new variants emerge and require additional booster shots. Over the longer term, understanding differences in vaccination rates is important for building resilience to future health shocks. The fact that past flu vaccination remains amongst the best predictors or COVID-19 vaccination suggests that policies that aim to improve understanding of the benefits of vaccination in general, along with the willingness of GPs to prescribe vaccinations and the quality of the health systems are all important in improving a country’s resilience to the threat of a new pandemic.

References

Turner, D., et al. (2022), “Understanding differences in vaccination uptake among OECD countries”, OECD Economics Department Working Papers, No. 1704, OECD Publishing, Paris, https://doi.org/10.1787/76482043-en.

Oliu-Barton, M., B. Pradelski, N. Woloszko et al. (2021), “The effect of COVID certificates on vaccine uptake, public health, and the economy”, Conseil d’Analyse Économique, Paris. https://www.cae-eco.fr/limpact-des-pass-sanitaires-sur-le-taux-de-vaccination-la-sante-et-leconomie

Chang, T. et al. (2021), “Financial Incentives and Other Nudges Do Not Increase COVID-19 Vaccinations among the Vaccine Hesitant”, National Bureau of Economic Research, Cambridge, MA, http://dx.doi.org/10.3386/w29403.

Kloiber, K., A. Peichl and H. Winner (2021), “‘Schnitzel Scare’ as a Boost for Vaccines? The Impact of 2G Rules and Lockdowns on Vaccination Rates in Austria”, IFO Institute, https://www.ifo.de/en/publikationen/2021/article-journal/schnitzelpanik-als-impfturbo-die-auswirkungen-von-2g-regeln


Debt sustainability and low interest rates: A word of caution

By David Crowe, Jörg Haas, Valentine Millot, Łukasz Rawdanowicz and Sébastien Turban, OECD Economics Department

Debates about sovereign debt sustainability have revived in light of the massive increases in debt since the 2008 economic crisis and more recently during the COVID-19 pandemic. In this context, some argue that debt sustainability risks are significantly reduced as long as the interest rate is lower than the rate of GDP growth. We offer a word of caution in our recent paper: Constraints and demands on public finances: Considerations of resilient fiscal policy (Rawdanowicz et al., 2021).

While it is true that such a negative interest rate-growth differential (the so-called r-g) helps to stabilise debt in the very long term, debt dynamics in the near term depend also on the primary budget balance, and a continued increase in debt cannot be excluded with large primary budget deficits. Conversely, debt could fall substantially with moderate primary deficits. We should also note that maintaining high debt raises countries’ vulnerability to interest rate surges and growth declines, and increases debt rollover risks. This is all the more important given the uncertainty about, and the volatility of, r-g (Orszag, Rubin and Stiglitz, 2021; Mauro and Zhou, 2020).

Negative r-g does not eliminate risks to debt sustainability and fiscal authorities should pay attention to primary budget balances, which reflect the political choices in terms of revenues and spending, thus contributing to shape the strength of the economy through various channels.

Government interest payments declined despite rising gross debt

The fiscal response to the COVID-19 crisis prevented larger declines in employment, income and output, and is paving the way for a sustainable recovery. At the same time, government debt relative to GDP has reached the highest levels in several decades, adding to a pre-crisis upward trend in sovereign debt (Figure 1, Panel A).

Figure 1. Government interest payments and r-g declined despite rising gross debt

Note: In Panel A, the median and the inter-quintile range between the first and fourth quintiles (shaded area) refer to the distribution of general government interest payments as a per cent of GDP. Gross debt refers to the OECD definition of general government financial liabilities. In Panel B, the lines indicate the medians of the distribution of interest rate-growth differentials. See Annex B in Rawdanowicz et al., (2021) for the definitions of the two versions of the interest rate-growth differentials. The sub-group of OECD countries refers to countries for which long time series are available: Austria, Belgium, Canada, Denmark, Finland, France, Germany, Italy, Japan, the Netherlands, Spain, Sweden, Switzerland, the United Kingdom and the United States. As the start of time series differs slightly within the country group, medians and the first and fourth quintiles are calculated only when data for at least 75% of the number of countries in the group are available.
Source: OECD Economic Outlook database; and authors’ calculations.

Despite rising debt, government interest payments have declined since the 1980s, reaching just above 1% of GDP in the median OECD economy (Figure 1, Panel A). This was possible due to falling nominal and real yields on longer‑term government bonds that started in the late 1980s and the early 1990s. The falling interest rates helped lower the trend in the effective r-g, mitigating the impact of the increase in gross debt on public finances (Figure 1, Panel B).

Negative r-g always stabilises debt, but potentially at high levels

Persistently negative r‑g helps lower debt. Together with moderate levels of primary budget deficits, debt reductions can be substantial in these circumstances, especially at high initial debt levels as shown in stylised and illustrative simulations (Figure 2).

Figure 2. Negative r-g can reduce the debt-to-GDP ratio significantly when primary deficits are modest

Note: Stylised simulations assume that primary balances (pb, in % of GDP) and the interest rate-growth differentials (r-g, in percentage points) remain unchanged at the indicated levels over the simulation period. Simulations assume no government financial assets (net and gross debt are identical) and no statistical discrepancy.
Source: Authors’ calculations.

Actually, debt will stabilise with any constant primary budget deficit when r-g is negative. However, depending on the level of the primary budget balance and r-g, this stabilisation may only occur after a prolonged and large increase in debt. To demonstrate this point, in our working paper we presented stylised and purely illustrative simulations for different values of initial debt, the primary budget balance, and the level of r-g. Both the size of the negative r-g and the primary budget balance are fundamental for determining the speed and the level at which the debt to GDP ratio stabilises, while initial debt is less important.

High debt carries risks for public finances

As debt can stabilise at a high level and only in a distant future despite a negative r-g, two additional issues are important in assessing debt sustainability.

First, increasing and elevated debt can lead to higher interest rates and make public finances vulnerable to changes in economic conditions in general, and interest rates in particular. For instance, declines in GDP can bring about big increases in the debt-to-GDP ratio through the same mechanism through which negative r-g can help stabilise debt levels, exacerbated by cyclical deteriorations in the primary budget balance. Such debt increases may be difficult to reverse if growth is low and budget deficits remain large several years after a recession. Moreover, the longer-term evolution of government bond yields is highly uncertain (Orszag, Rubin and Stiglitz, 2021) and current low effective interest rates in relation to GDP growth do not exclude a possibility of future high sovereign yields (Mauro and Zhou, 2020). In general, high debt may limit the fiscal space to accommodate negative shocks and thus result in sub-optimal fiscal responses to future recessions (Jordà, Schularick and Taylor, 2016).

Second, at current debt levels, OECD countries will have to issue significant amounts of bonds in coming years. Some of the rollover risks could be mitigated by managing debt maturity to avoid concentration of large debt rollovers. Central banks’ purchases of government bonds could also help mitigate rollover risks, but maintaining positive confidence may require very large (gross) purchases.

References

Jordà, Ò., M. Schularick and A. Taylor (2016), “Sovereigns versus banks: Credit, crises, and consequences”, Journal of the European Economic Association, Vol. 14/1, pp. 45-79, http://dx.doi.org/10.1111/jeea.12144.

Mauro, P. and J. Zhou (2020), “r minus g negative: Can We Sleep More Soundly?”, IMF Working Papers, Vol. 20/52, http://dx.doi.org/10.5089/9781513536071.001.

Orszag, P., R. Rubin and J. Stiglitz (2021), “Fiscal resiliency in a deeply uncertain world: The role of semiautonomous discretion”, PIIE Policy Brief, No. 21-2, Peterson Insitute for International Economics, https://www.piie.com/publications/policy-briefs/fiscal-resiliency-deeply-uncertain-world-role-semiautonomous-discretion.

Rawdanowicz, Ł. et al. (2021), “Constraints and demands on public finances: Considerations of resilient fiscal policy”, OECD Economics Department Working Papers, No. 1694, OECD Publishing, Paris, https://dx.doi.org/10.1787/602500be-en.


Improving skills and employment opportunities in Tunisia

By Robert Grundke and Andrea Goldstein, OECD Economics Department

Tunisia has been among the emerging market economies hardest hit by the COVID-19 crisis, which caused the deepest economic contraction ever, with a heavy social cost. Unemployment has increased to over 18%, and is particularly high among youth (42%). However, the 2020-21 crisis has just exacerbated a problem that has been there for decades. Unemployment rates have hovered above 12% since the 1990s, with much higher rates for young labour market entrants. The new Economic Survey of Tunisia shows that this is due to a broad range of structural factors, which complicate the adjustment of labour demand and labour supply and prevent the labour market from clearing.

Figure 1. Unemployment has been persistently high

Note: The unemployment rate is calculated as the share of the unemployed in the labour force.
Source: WB, ILO, INS, CEIC; and OECD Economic Outlook database.

First, high barriers to firm entry and growth as well as barriers to international trade lead to weak business dynamism and discourage the creation of more and better jobs. The lack of sufficient job creation, coupled with a strong rise in the working age population, has led to particularly high unemployment rates among youth. Moreover, rising access to education has increased the supply of high-skilled labour, but the business sector has mainly created jobs in low-skill intensive and low-productivity activities. This has led to high unemployment rates among tertiary graduates and particularly for women who represent two thirds of tertiary graduates.

However, low-skilled young men and women also suffer from weak job creation. The lack of formal job opportunities forces many young men without a tertiary degree to accept low-paid work in the informal sector. Informal employment accounts for 47% of total employment in 2021, and is concentrated in agriculture, construction, retail, transport and hospitality services. For young low-skilled women, although cultural reasons related to family and household work play an important role, difficulties to find a formal job are the predominant reason why they leave the labour force. The labour force participation rate for young women without a tertiary education degree is below 25%, whereas it is around 50% for women with tertiary degree and above 70% on average for men.

To foster business dynamism and innovation and create more and better jobs, it is crucial to lower regulatory barriers to market entry and entrepreneurship, raise the international integration of domestic firms and adjust labour taxes. Reducing prior authorisation for market entry and investment, lowering administrative burden and simplifying the tax system would provide new opportunities for small, young and innovative firms, foster formal job creation and raise productivity growth. This should be complemented by a reduction in tariffs and non-tariff barriers, as high import barriers reduce access to high-quality inputs and capital goods for onshore firms, which predominantly serve the domestic market, and hinder the adoption of new technologies. Moreover, reducing the income tax rate for the lowest-income bracket and allowing for more flexibility in wage setting for smaller firms would raise formalisation.

Second, despite high unemployment rates, many firms report that they do not find workers with the skills they need. This is due to the low quality of education and training systems and their weak responsiveness to the skills needs of the private sector. Besides technical and job-specific skills, many job applicants are missing fundamental soft skills, such as oral and written communication, foreign languages, team-working, problem solving and conflict resolution. To address this problem, the quality of education and vocational training needs to improve. This requires enhancing teacher selection, evaluation and training, with a special focus on pedagogical skills, improving school infrastructure, providing high quality language teaching from an early age, and focusing on soft skills. Expanding access to early-childhood education, particularly for low-income and single-parent families, would reduce inequality in opportunities. To make education and training systems more responsive to skill demand in the private sector, it is crucial to better link VET and university curricula with workplace training by improving the legal framework and encouraging a more active participation of firms.

Figure 2. In spite of high unemployment, many job vacancies cannot be filled

Note: Data on active job seekers and vacancies comes from the information system of the public employment agency (ANETI) and does not include unemployed persons that do not actively search through ANETI. If job seekers have not visited the public employment office for more than 2 months, they are automatically excluded from the database. Passively unemployed persons refers to the difference between the total number of unemployed as indicated by the labour force survey and the number of active job seekers registered at ANETI.
Source: ANETI and Labour Force Survey Tunisia.

Third, the regional concentration of economic activities combined with low interregional labour mobility reduces the potential labour supply for firms, further contributing to recruitment difficulties. Unemployment rates are persistently higher in interior compared to coastal governorates, indicating a relatively low internal mobility of labour. Due to weak income support to the unemployed, many of them rely on support from the family for housing and food, which reduces their geographic action space in the labour market. Cultural norms amplify these barriers for single women, who may face difficulties to travel and live alone far away from the family. Moreover, public employment services are weak due to severe capacity constraints and insufficient coordination between regional offices. As private job placement services face legal difficulties to operate, the unemployed mainly use personal contacts for searching a job, which complicates matching of vacancies and job seekers.

To increase labour mobility and allow for better labour market matching, it is crucial to improve public employment services by allocating more resources to personal counselling services, training counsellors, combining counselling with targeted training support, and allowing for more competition from private providers. Active labour market policies should be better targeted towards individuals most in need, and regular impact evaluation of programmes should be introduced. To reduce incentives for tertiary graduates to remain unemployed while waiting for well-paid public sector jobs, wage schedules in the public sector and SOEs should be redesigned to narrow the gap with the private sector and public recruitment processes should be open to all applicants, including experienced workers from the private sector.

Reference

OECD (2022), OECD Economic Surveys: Tunisia 2022, OECD Publishing, Paris, https://doi.org/10.1787/7f9459cf-en.


Améliorer les compétences et les perspectives d’emploi en Tunisie

Par Robert Grundke et Andrea Goldstein, Département des affaires économiques de l’OCDE

La Tunisie compte parmi les économies de marché émergentes les plus durement touchées par la crise du COVID-19, qui a provoqué la plus forte contraction économique jamais enregistrée, tout en causant un lourd tribut social. Le taux de chômage est monté à 18%, et il est beaucoup plus élevé chez les jeunes (42%). Pourtant, la crise de 2020-21 a simplement aggravé un problème que caractérise l’économie tunisienne depuis des décennies. Le taux de chômage se maintient au-dessus de 12 % depuis les années 90, et il est beaucoup plus élevé pour les jeunes primo-demandeurs d’emploi. La nouvelle Étude économique de la Tunisie montre que ce problème est lié à un large éventail de facteurs structurels qui compliquent l’ajustement de l’offre et de la demande de main-d’œuvre et empêchent donc de parvenir à l’équilibre sur le marché du travail.

Graphique 1. Le taux de chômage reste élevé

Note : Le taux de chômage correspond à la part des chômeurs dans la population active.
Source : Banque mondiale ; Organisation internationale du travail (OIT) ; Institut national de la statistique (INS) ; CEIC ; et base de données des Perspectives économiques de l’OCDE.

Premièrement, les obstacles à l’entrée et à la croissance des entreprises et les barrières au commerce international diminuent le dynamisme du secteur privé et freinent la création d’emplois plus nombreux et de meilleure qualité. L’insuffisante création d’emploi, associée à la forte augmentation de la population en âge de travailler, a engendré des taux de chômage particulièrement élevés parmi les jeunes. En outre, l’essor de l’accès à l’éducation a permis d’accroître l’offre de main-d’œuvre hautement qualifiée, mais, dans le secteur privé, la majorité des emplois ont été créés dans des activités peu productives et à faible intensité de main-d’œuvre qualifiée. Cela a mené à des taux de chômage plus élevés parmi les diplômés de l’enseignement supérieur et particulièrement chez les femmes, qui représentent environ deux tiers des diplômés de l’enseignement supérieur.

Cependant, les jeunes hommes et femmes peu qualifiés souffrent eux aussi de la faible création d’emploi. Á défaut d’une offre suffisante d’emplois formels, beaucoup de jeunes hommes sans diplôme de l’enseignement supérieur sont forcés d’accepter des postes dans le secteur informel. L’activité informelle a atteint un taux de 47 % de l’emploi total en 2021, et se concentre dans les secteurs de l’agriculture, du BTP, du commerce de gros et de détail, des transports, et de l’hôtellerie et de la restauration. Pour les jeunes femmes peu qualifiées, bien que des raisons culturelles liées à la famille et aux tâches ménagères jouent un rôle important, les difficultés à trouver un emploi formel sont la raison prédominante de leur sortie du marché du travail. Les jeunes femmes non diplômées de l’enseignement supérieur ont un taux d’activité inférieur à 25 %, alors qu’il est d’environ 50 % pour celles qui possèdent un diplôme de l’enseignement supérieur et de plus de 70 % en moyenne pour les hommes.

Pour renforcer la dynamique des entreprises et l’innovation, ainsi que pour promouvoir la création d’emplois plus nombreux et de meilleure qualité, il est essentiel de réduire les obstacles réglementaires à l’entrepreneuriat et à l’entrée de nouveaux acteurs sur le marché, d’accroître l’intégration internationale des entreprises locales et d’ajuster les impôts sur le travail. Réduire les autorisations préalables pour opérer sur le marché et investir, abaisser les formalités administratives et simplifier le système fiscal créeraient de nouvelles occasions pour les petites et jeunes entreprises innovantes, augmenteraient la création d’emplois formels et la croissance de la productivité. Cela devrait être accompagné par une réduction des droits de douane et des obstacles non tarifaires au commerce extérieur, car les obstacles à l’importation élevés réduisent la possibilité d’accéder à des intrants et à des biens d’équipement de qualité pour les entreprises axées sur le marché local (onshore) et compliquent l’adoption des nouvelles technologies. En outre, réduire le taux d’imposition de la première tranche de revenu et autoriser une plus grande flexibilité dans la fixation des salaires pour les petites entreprises permettraient de développer le secteur formel.

Deuxièmement, malgré le niveau élevé du chômage, les entreprises sont nombreuses à affirmer de ne pas trouver de main-d’œuvre possédant les compétences recherchées. Ce phénomène s’explique par la faible qualité des systèmes d’enseignement et de formation et leur manque d’adaptabilité aux besoins en compétences du secteur privé. Outre les compétences techniques et professionnelles, de nombreux candidats manquent de compétences non-techniques et de savoir-être (soft skills) fondamentales, comme la communication orale et écrite, les langues étrangères, le travail en équipe et la résolution des problèmes et des conflits. Pour résoudre ce problème, la qualité de l’enseignement et de la formation professionnelle doit s’améliorer. Il faut renforcer la sélection, l’évaluation et la formation des enseignants, avec une attention particulière aux compétences pédagogiques, améliorer les infrastructures dans les écoles, fournir aux élèves un apprentissage de qualité de langues dès le plus jeune âge et mettre davantage l’accent sur les compétences générales et les soft skills. Élargir l’accès à l’éducation préscolaire, en particulier pour les ménages à faible revenu et les familles monoparentales, permettrait de réduire les inégalités des chances. Pour mieux adapter les systèmes d’enseignement et de formation aux besoins en compétences du secteur privé, il faut lier plus étroitement les filières de la formation professionnelle et les programmes universitaires avec la formation en milieu professionnel en améliorant le cadre juridique et en promouvant une participation plus active des entreprises.

Graphique 2. Malgré un chômage élevé, de nombreux postes vacants ne peuvent être pourvus

Note : Les données sur les demandeurs d’emploi actifs et les postes vacants proviennent du système d’information de l’agence publique pour l’emploi (ANETI) et ne comprennent pas les chômeurs qui ne sont pas en recherche active selon cette agence. Si les demandeurs d’emploi ne se sont pas rendus à l’ANETI depuis plus de 2 mois, ils sont automatiquement radiés de la base de données. Les chômeurs passifs correspondent à la différence entre le nombre total de chômeurs indiqué par l’enquête sur la population et l’emploi et le nombre de demandeurs d’emploi actifs inscrits à l’ANETI.
Source : ANETI et enquête nationale sur la population et l’emploi pour la Tunisie.

Troisièmement, la concentration régionale des activités économiques, conjuguée à une faible mobilité inter-régionale, appauvrit l’offre de travail pour les entreprises et aggrave les difficultés de recrutement. Les taux de chômage sont plus élevés dans les gouvernorats de l’intérieur depuis longtemps, ce qui est un signe de mobilité interne relativement faible de la main-d’œuvre. En raison des aides au revenu limitées pour les chômeurs, nombreux d’entre eux dépendent du soutien de leur famille pour le logement et la nourriture, ce qui réduit leur rayon d’action géographique sur le marché du travail. Les normes culturelles renforcent ces obstacles pour les femmes célibataires, car elles rencontrent parfois des difficultés pour voyager et vivre seules loin de leur famille. En outre, les services publics de l’emploi sont faibles en raison des contraintes de capacité significatives et l’information sur les offres et demandes d’emploi au niveau régional n’est pas accessible dans le reste du pays. Comme les services de placement privés se heurtent à des difficultés juridiques pour exercer leurs activités, les chômeurs utilisent surtout leur réseau personnel pour chercher un emploi, ce qui complique l’adéquation entre les offres et les demandes d’emploi.

Pour accroître la mobilité du travail et faire mieux coïncider l’offre et la demande sur le marché du travail, il faut impérativement améliorer les services publics de l’emploi en allouant davantage de ressources aux services de conseil personnalisé, en améliorant la formation des conseillers, en combinant conseil et aide ciblée à la formation et en laissant davantage jouer la concurrence des prestataires privés. Les programmes d’activation du marché du travail doivent cibler mieux les individus qui en ont le plus besoin, et doivent être accompagnés par des évaluations d’impact. Afin de réduire les facteurs incitant les diplômés de l’enseignement supérieur à préférer rester au chômage en attendant de trouver un emploi bien payé dans le secteur public, il faut réduire les écarts de salaires entre l’administration et les entreprises publiques et le secteur privé et ouvrir davantage les procédures de recrutement de la fonction publique à tous les candidats, y compris aux travailleurs expérimentés du secteur privé.

Références

OCDE (2022), Études économiques de l’OCDE : Tunisie 2022, Éditions OCDE, Paris, https://doi.org/10.1787/69ef3240-fr.


Insights from past large and prolonged sovereign debt reductions in OECD countries

By David Crowe, Valentine Millot and Łukasz Rawdanowicz, OECD Economics Department

Due to the COVID-19 crisis, sovereign debt in relation to GDP has increased massively, reaching the highest levels in several decades in many countries. Current low interest rates reduce concerns about debt sustainability, but high debt makes public finances vulnerable to negative shocks. Thus, governments will have to balance the need to minimise the risk of fiscal stress and the need to satisfy growing demands on public finances.

In this context, in our recent paper Constraints and demands on public finances: Considerations of resilient fiscal policy (Rawdanowicz et al., 2021), we analyse 17 episodes of large and prolonged sovereign debt reductions in OECD countries since the 1970s. We find that such debt reductions were achieved primarily by increasing budget surpluses, supported by a context of strong nominal GDP growth (on average 7%). Debt reduction episodes were initiated in response to rising debt and interest payments, sometimes resulting from economic crises. It is noteworthy that in some cases debt reduction episodes were accompanied by revamping fiscal frameworks.

There are many examples of large and prolonged debt reductions

We identify 17 episodes that involved persistent reductions in gross debt (spanning at least five years, but allowing for temporary debt reversals) of at least 15% of GDP, in contrast to a traditional focus in the literature on fiscal consolidations which are measured by changes in budget balances – e.g. (Molnár, 2012) (Figure 1). Most of the episodes started in the 1990s and ended before the global financial crisis. On average across the episodes, debt was reduced by just over 30% of GDP over 11 years, but the size and duration varied across the episodes (Figure 1, Panel A). In many episodes, initial debt was no higher than 80% of GDP and, in most cases, the debt‑to‑GDP ratio was reduced by less than half (Figure 1, Panel B).

Figure 1. Episodes of large and prolonged sovereign debt reductions: main statistics

Note: Episodes selected based on data availability in the OECD Economic Outlook database. The snowball effect captures the product of lagged gross debt and the interest rate-growth differential (see Annex B of Rawdanowicz et al. (2021) for explanations on the debt dynamics decomposition).
Source: OECD Economic Outlook database; and authors’ calculations.

High budget surpluses and strong GDP growth were instrumental in lowering debt

Most of the debt reductions took place in an environment of high nominal GDP growth (on average 7% across countries and years; Figure 1, Panel C), in particular in Hungary and the United Kingdom. The notable exceptions are Germany and Switzerland (2004-2018), where nominal growth was modest but still r-g was negative and the budget surpluses were high. In line with this, in most cases, the primary budget balance‑to‑GDP ratio improved as primary revenue increased by more or declined by less than primary spending (Figure 2, Panel A). In addition, average growth in nominal primary expenditure was not higher than average nominal GDP growth (Figure 2, Panel B). In some countries (e.g. Finland and Canada), the debt reduction episode also coincided with a substantial depreciation of the domestic currency, helping export growth (Figure 2, Panel C).

Decomposing the annual average changes in debt (see details in Annex B of Rawdanowicz et al. 2021) shows that in most of the episodes a high primary budget surplus reduced debt – on average by 2% of GDP per annum, but in some cases by more than 3% of GDP (Figure 1, Panel A). In two thirds of the episodes, higher growth than interest rates lowered the debt-to-GDP ratio (Figure 1, Panel C), with a total contribution of the snowball effect to the debt reduction (i.e. a combined effect of the interest rate growth differential and the lagged level of gross debt) on average close to 1% of GDP per year. A few countries benefited also from favourable stock flow adjustments (i.e. all changes in the debt ratio that are not explained by the budget balance and the snowball effect, like sale or purchase of financial assets). This was particularly the case in Iceland and the Slovak Republic due to very large interest earnings and a sizeable reduction in the ratio of government financial assets to GDP, respectively.

Figure 2. Episodes of large and prolonged sovereign debt reductions: additional statistics  

Note: Episodes selected based on data availability in the OECD Economic Outlook database. Export market is calculated as a weighted average of trading partners’ import volumes.
Source: OECD Economic Outlook database; and authors’ calculations.

While the economic and political context triggering debt reductions varied across countries, there were a few common themes

Growing fiscal pressures. In several episodes, debt reductions were initiated following prolonged and large debt accumulations. Falling interest rates and subsequently government interest payments helped the debt reductions in the 1990s. In some countries, at the beginning of debt reductions, interest payments amounted to at least 5% of GDP and in Belgium and Canada around 10% of GDP, crowding out other spending.

Fiscal rules and frameworks encouraged actions to reduce debt. In several EU countries, the requirement to fulfil the Maastricht fiscal criteria (budget deficit no higher than 3% of GDP and government debt below 60% of GDP) ahead of adoption of the euro contributed to public debt reductions. In Canada, to help deal with large budget deficits of provincial and federal governments in the early-1990s, many provinces voluntarily adopted fiscal rules. The Federal government introduced the Spending Control Act between 1992 and 1995 and since then has generally used non-legislated fiscal targets, helping to achieve high budget surpluses in the subsequent years. In New Zealand, fiscal discipline was accompanied by the introduction of a new budgetary framework (the 1994 Fiscal Responsibility Act), building on responsible fiscal management principles. The Act also enforced greater transparency about the fiscal situation and fiscal policies.

Negative economic shocks. In a few countries, severe economic crises required fiscal adjustments, thereby securing popular support for adjustment. For instance, in Finland the deep recession following a financial crisis in the early 1990s prompted the government to implement large cuts in government spending (including social benefits, public sector wages, subsidies, investment, and transfers to sub-central governments), with the aim to restore confidence in financial markets and to achieve a non-inflationary recovery. The impact of these measures on debt reduction was strengthened by the move to a floating exchange rate that led to a sharp depreciation of the local currency. In Sweden, the severe banking and economic crises in the early 1990s led the government to implement several structural reforms covering governance of the public finances, tax reforms, liberalisation of the economy, reforming the welfare state (pensions especially), and promoting an export-oriented growth model. However, we should acknowledge that for these countries, favourable global economic conditions boosted exports, contributing to the resumption of economic growth and debt reduction.

References

Molnár, M. (2012), “Fiscal consolidation: What factors determine the success of consolidation efforts?”, OECD Journal: Economic Studies, https://dx.doi.org/10.1787/eco_studies-2012-5k8zs3twgmjc.

Rawdanowicz, Ł. et al. (2021), “Constraints and demands on public finances: Considerations of resilient fiscal policy”, OECD Economics Department Working Papers, No. 1694, OECD Publishing, Paris, https://dx.doi.org/10.1787/602500be-en.