Statistical Insights: Merchandise trade statistics without asymmetries
by Fabienne Fortanier, Head of Trade Statistics Section, OECD Statistics Directorate
 To properly understand global trade patterns we need high quality, consistent and harmonised statistics on international merchandise trade. Currently available statistics, however, fall short of this standard. In theory the exports of country A to country B should mirror the imports of country B from country A, but in practice this is rarely the case. To tackle this issue the OECD, through its Working Party on International Trade in Goods and Services Statistics, bringing together over 40 countries, has developed a transparent and replicable approach for reconciling international merchandise trade statistics. The first version of the resulting dataset is now available.
How large are trade asymmetries?
Table 1 shows some of the largest asymmetries in reported global trade, by main product category. And they are very large. For example, the US reports USD 35 billion more imports of electrical machinery from China than China reports as exports to the US; accounting for around one-third of the actual value traded. The twelve top discrepancies alone (out of nearly 100 products and over 200 countries), account for USD 182 billion, or 1% of global merchandise trade.

Why do trade asymmetries exist?
Asymmetries in international merchandise trade statistics exist for a variety of reasons. First of all, exports and imports are valued differently: exports are valued ‘free on board’ (FOB), but imports include the ‘costs of insurance and freight’ (CIF). This margin however averages just 5% of international trade flows (Miao and Fortanier, 2017) and so explains only a small part of the discrepancies. Differences in customs regimes and methodologies also have an effect, as do differences in confidentiality policies, product classifications, and time of recording.
But the most important source of discrepancy is the convention that merchandise trade statistics record imports by country of origin and exports by country of last known destination. This inevitably means that import data will not mirror export data – and the gaps are steadily widening as global production chains become more complex.
Resolving asymmetries – the measure explained
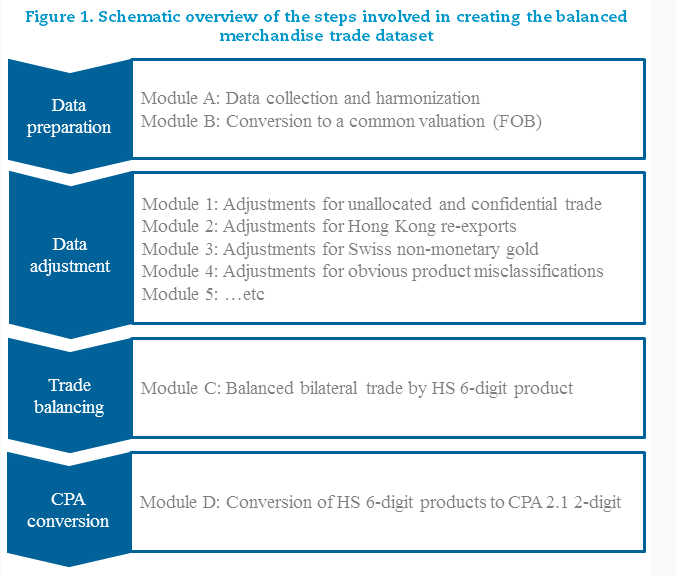
The OECD has developed a four-step process to reconcile merchandise trade asymmetries (Figure 1). First, data are collected and organised, and imports are converted to FOB prices to match the valuation of exports. Secondly, data are adjusted for several specific large problems known to drive asymmetries. Presently these include ‘modular’ adjustments for unallocated and confidential trade, for re-exports by Hong Kong, China, for Swiss non-monetary gold, and for clear-cut cases of product misclassifications. The list of modules is expected to grow over time. In the third step, adjusted data are balanced using a ‘Symmetry Index’ that weights exports and imports, giving a higher weight to the country with less asymmetry in its reported bilateral trade flows. This Index reflects the share of a reporter’s bilateral trade for which the absolute difference with the reported mirror flow is 10% or less of the sum of these two flow values. All calculations are made at the detailed product level (HS 6-digit), and the dataset is available at this level. However, in a final step, the data are also converted to Classification of Products by Activity (CPA) products to better align with National Accounts statistics, such as in national Supply-Use tables.
As a concrete example of how adjustments are made, take re-exports by Hong Kong, China (hereafter Hong Kong). Hong Kong is a major hub for international merchandise trade, and re‑exports account for no less than 96% of its total exports. This leads to large asymmetries, because, following international methodological standards, Hong Kong reports exports to those countries where the products are sent, but the same countries report them as imports not from Hong Kong, but from the country in which they were originally produced.
These asymmetries can be reduced by using the Hong Kong Census Office’s detailed 6-digit data on the country of origin of its re-exports. Table 2 illustrates this in the case of data for 2011 on trade in Harmonised System product category 851762 (“Machines for the reception, conversion & transmission/regeneration of voice, images and other data”). The first data column shows the reported figures by each respective country, and the second column, the adjusted figures. The first column shows that China recorded nearly USD 5 billion of exports to the US, with Hong Kong exporting a further USD 2.1 billion, virtually all of which (USD 1.9 billion) were re-exports from China. In contrast, and consistent with the country of origin principle, the US recorded virtually all of its imports of these goods as coming from China (nearly 9 billion USD), with negligible amounts from Hong Kong. The second column reattributes US imports passing through Hong Kong as imports from Hong Kong, reducing imports attributed to China by the same amount. Note that this does not change China or Hong Kong’s reported exports, or the total value of the US’s reported imports. But changing the geographical attribution of US imports reduces the asymmetry between China and the US by almost half, and practically eliminates the asymmetry between Hong Kong and the US.
Applying this method reduces asymmetries between Hong Kong exports and partner country imports by 60% overall, and to practically zero for many partner countries. Asymmetries between country pairs like the US and China that trade significantly via Hong Kong are also reduced by 5-10%.
Importantly, by tracking the physical flow of goods, the approach adopted in the database provides a means to better highlight the port and transportation services, related to ‘entrepôt’ transactions, in trade in value added statistics.

Where to find the underlying data
The database currently contains data for 83 countries for all 2-digit CPA products for the period 2007 to 2014. More countries and years (from 2002 to 2016) will be added in Q1 2018 and updates will be conducted on an annual basis from hereon in. The plan over the next two years will be to accelerate the production process such that the most timely data are available with a lag of no more than one year to the reference period. Further work to reduce asymmetries in official data, including through bilateral and multilateral meetings, is under way in collaboration with national statistical offices and other international organisations.
Further reading
- Miao, G and F. Fortanier (2017), “Estimating Transport and Insurance Costs of International Trade”, OECD Statistics Working Papers, 2017/04.
- Fortanier, F (2016), ‘Towards merchandise trade statistics without asymmetries’, The OECD Statistics Newsletter, issue 64.