The risks in Canada’s unusual housing market(s)
By Peter Jarrett, Head of Division, Country Studies, OECD Economics Department
Local housing markets are presently highly disparate in Canada. While in most smaller localities real estate prices are fairly stable and not out of line with the fundamentals (incomes and rents), 10 of the 15 large Census Metropolitan Areas monitored by the Canada Mortgage and Housing Corporation (CMHC) show signs of overvaluation, and seven show moderate or strong evidence of overbuilding. By contrast, prices have fallen quite sharply from previously lofty levels in a few communities whose economies are heavily dependent on resources (Calgary in particular). But house prices in Toronto and especially Vancouver, which together make up one third of the national housing market, are such that, in tandem with high household debt (which nationally reached 167.6% of disposable income at end-2015, near the top of the OECD country range), they represent a significant financial vulnerability. A sharp fall in house prices triggered by a shock that results in a large increase in unemployment could weaken households’ ability to service their debts, resulting in a rise in mortgage defaults that could endanger financial stability.
One factor driving market strength in Vancouver and Toronto is foreign buying. Unfortunately, limited data are available on such purchases, but the federal government has allocated some funding for Statistics Canada to begin to gather such data. Another is building site supply constraints: these are both physical – Vancouver is bounded by the Pacific Ocean and coastal mountains, while Toronto is bordered by Lake Ontario – and regulatory – such as Toronto’s green belt of some 800 000 hectares and Vancouver’s provincial zone of protected farmland. These constraints curb the normal supply response to appreciating property prices. Nevertheless, the share of residential investment in Canada’s GDP is currently the OECD’s highest, even if well below earlier peaks in Ireland and Spain. Strong residential investment may in principle reflect robust demographic growth, but Canada’s outcome appears stronger than what can be justified by underlying population increases. And the larger the share the further it could fall if the boom ends with a bang.
While low interest rates have helped to reduce interest-related obligations and safeguard affordability, broader debt-service ratios including required principal payments are above historical averages. In addition, according to the Bank of Canada, debt has become more concentrated in the hands of highly indebted younger households, who may be less able to cope financially with a job loss or interest rate increases. Nevertheless, Canadian mortgages are issued on a recourse basis, and most households have plenty of equity in their homes (73% on average). In addition, banks must test mortgage qualification for insured mortgages with terms less than five years or with variable interest rates against a benchmark five-year interest rate, which is currently about two percentage points above market five-year mortgage rates, affording some degree of protection. In December 2015, OSFI (the Office of the Superintendent of Financial Institutions), the financial supervisor, announced planned changes to the regulatory capital frameworks for residential mortgages for large federally regulated lenders and private mortgage insurers so that capital requirements keep pace with housing market developments and risks, such as when regional house prices are high relative to incomes. Moreover, following a series of macro-prudential measures implemented since 2008, the federal government boosted down-payment requirements for insured mortgages in February 2016 from 5 to 10% for the portion of each insured home priced between CAD 500 000 and CAD 1 million, which is the ceiling on availability of public mortgage insurance. Stress testing on the six large banks has been carried out regularly in the last few years, and, while results are not published, the Bank found that all balance sheet ratios exceed minima required by OSFI. Moreover, nonperforming loans remain low at only 0.5% of gross loans. This said, macro-prudential measures should be tightened further and targeted regionally, as in New Zealand, where the authorities imposed lower ceilings on loan-to-value ratios in 2015 in the booming Auckland market and are considering further steps. Targeted measures could go beyond OSFI’s planned changes to capital guidelines in regions with high house price-to-income ratios or strong house price growth to make capital requirements more responsive to market developments and risks.
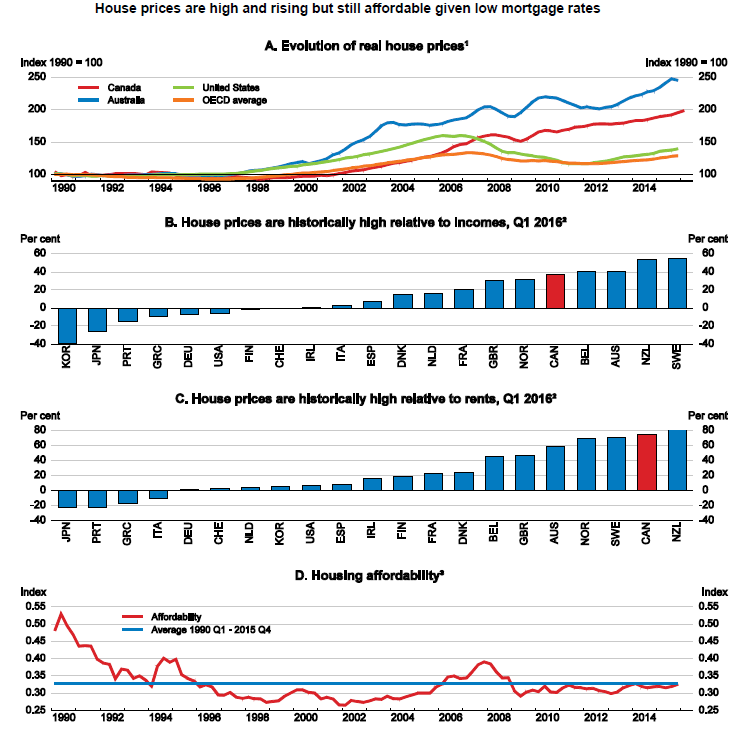
1. Nominal house prices deflated by the private consumption deflator.
2. Deviation of the ratio of nominal house prices/nominal disposable income per capita (respectively /rent prices) over the long-term average. The long-term average starts in Q1 1980 for most countries, with a few exceptions. The price-to-income ratio starts in Q1 1981 for Denmark, Q1 1986 for Korea and New Zealand, Q1 1987 for the United Kingdom, Q1 1995 for Portugal and Q1 1997 for Greece. The price-to-rent ratio begins in Q1 1986 for Korea, Q1 1988 for Portugal and Q1 1997 for Greece. The latest observation is Q4 2015/Q1 2016.
3. The affordability index provides an estimate of the share of disposable income that a representative household would put toward housing-related expenses. The measure is a ratio, where the numerator, housing-related costs, is the sum of the average quarterly mortgage payment plus utility fees and the denominator is the average household disposable income. The higher the level, the more difficult it is to afford a home.
Source: OECD, Economic Outlook database; Bank of Canada, Financial Indicators, http://credit.bankofcanada.ca/financialindicators.
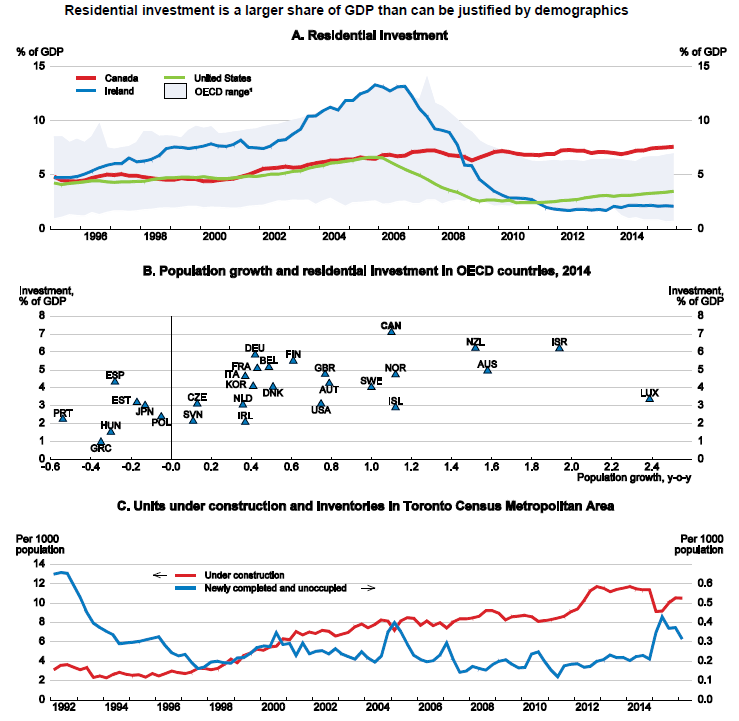
1. Excluding Canada.
Source: Statistics Canada, Tables 027-0060, 027-0047 and 051-0056; OECD, Economic Outlook database.
Reference:
OECD (2016), Economic Surveys: Canada, Vol. 2016, No. 16, OECD Publishing, Paris.